US Housing Data Analysis - 2025
Mon, 26 May 2025
Recently, some posts on social media were claiming that for-sale home listings in Washington DC were spiking, presumably due to recent cuts to government and other agencies. This post investigates data from Zillow Research, both to explore the US real estate market this year in general and to determine if such a claim holds any truth.
Tags: Data Analysis, Data Visualization, Housing, Housing-Market, Investing, Real-Estate, Realtor
Nonspecific: A Story About Diagnosis
Fri, 05 Jul 2024
It was late 2015. In a lot of ways, I felt on the top of my game and I thought I had life figured out. I was wrapping up a master’s degree in computer science. I had a 4.0 GPA. I could bench press 250 pounds. I had a girlfriend. I had my own car. I was renting a room just down the street from my school. I spent most of my time studying, at the gym, or playing music.
Tags: Uncategorized
The Matrix-Vector Product and the SVD
Fri, 17 Feb 2023
The singular value decomposition (SVD) allows one to re-write a given matrix as a sum of rank one matrices. Specifically, using the SVD, one may re-write a given matrix A as follows:
\[\displaylines{\mathbf{A}=\mathbf{U}\mathbf{\Sigma}\mathbf{V}^T = \sum\limits_{i=1}^{n}{\mathbf{U}_i\mathbf{\Sigma}_{ii}\mathbf{V}_i^T} }\ ,\]
where \(\mathbf{V}_i^T\) is the transpose of the i-th column of V. Further, the Eckart-Young-Mirsky theorem proves that the best rank k approximation to the matrix A is found by summing only the first k elements of the right-hand sum.Tags: Computer Science, Data Science, Machine Learning, Mathematics, Statistics
Cause of Death Records in 2021
Fri, 23 Dec 2022
This post explores Multiple Cause-of-Death records for the year 2021, taken from the U.S. Division of Vital Statistics. Specifically, the impact of the second full year of the coronavirus pandemic is explored in more detail.
Tags: Covid-19, Data Analysis, Data Visualization, Medicine, Software
Increases in Circulatory Death During the Coronavirus Pandemic
Tue, 20 Dec 2022
This post takes a closer look at Multiple Cause-of-Death records during the first year of the Coronavirus Pandemic. In this post, changes in mortality records involving the circulatory system (i.e. ICD-10 codes starting with I) are analyzed in more detail. These codes cover commonly occurring diseases like heart attacks, strokes, and other disease of the cardiovascular and, more broadly, the circulatory system.
Tags: Data Analysis, Data Visualization, Medicine
Cause of Death in the USA: 1959-2020
Wed, 07 Dec 2022
This post takes another look at Mortality Multiple Cause-of-Death records from the U.S. Division of Vital Statistics. Previous posts have analyzed records for the year 2016 and also deaths due to Influenza & Pneumonia in 2017. In this post, records from 1959 to the 2020, the latest year currently available, are analyzed.
Tags: Cause Of Death, Data Analysis, Data Visualization, Medicine, Statistics, Vital Statistics
Embedding Recipes using Kernel PCA
Fri, 04 Nov 2022
The previous post discusses Kernel PCA and recipes, or formulae, for deriving new kernels from known good kernels. This post applies these approaches to generate vector embeddings in a specific domain: culinary recipes. The idea is to find a low-dimensional representation of recipes such that points in the embedding space are neighbors to similar recipes.
Tags: Data Science, Data Visualization, Machine Learning
Kernel Recipes and Kernel PCA
Tue, 01 Nov 2022
One strength of kernel methods is their ability to operate directly on non-numerical objects like sets. As seen in the previous post, the Jaccard index on sets satisfies Mercer's condition and thus is a valid kernel. The process of proving a similarity measure is a valid kernel is somewhat involved, but thankfully several theorems can be employed to get more mileage out of the set of known good kernels. This post outlines some recipes for producing new valid kernels and introduces a method for obtaining numerical representations of samples using kernel methods.
Tags: Computer Science, Data Science, Data Visualization, Machine Learning
The Jaccard Kernel and its Implied Feature Space
Sat, 08 Oct 2022
Kernel methods leverage the kernel trick to implicitly perform inner products in often high and even infinite dimensional feature spaces. For instance, the radial basis function (RBF) kernel can be shown to map to an infinite-dimensional feature space. In general, if a similarity function can be shown to satisfy Mercer's Condition, one may operate on the finite-dimensional Gram matrix induced by the function, while receiving the benefit of mathematical guarantees about the implied transformation.
Tags: Data Science, Machine Learning, Mathematics
On The Importance of Centering in PCA
Fri, 09 Sep 2022
The previous post presents methods for efficiently performing principal component analysis (PCA) on certain rectangular sparse matrices. Since routines for performing the singular value decomposition (SVD) on sparse matrices are readily available (e.g. svds and TruncatedSVD), it is reasonable to investigate the influence centering has on the resulting transformation.
Tags: Computer Science, Data Science, Machine Learning, Statistics
Weighted Sparse PCA for Rectangular Matrices
Tue, 06 Sep 2022
Consider a sparse mxn rectangular matrix \(\mathbf{X}\), where either \(m >> n\) or \(m << n\). Performing a principal component analysis (PCA) on \(\mathbf{X}\) involves computing the eigenvectors of its covariance matrix. This is often accomplished using the singular value decomposition (SVD) of the centered matrix \(\mathbf{X}-\mathbf{U}\). But, with large sparse matrices, this centering step is frequently intractable. If it is tractable, however, to compute the eigendecomposition of either an mxm or an nxn dense matrix in memory, other approaches are possible.
Tags: Computer Science, Data Science, Machine Learning, Mathematics, Statistics
Weighted PCA
Fri, 08 Jul 2022
Consider an m by n matrix \(\mathbf{A}\) and an m by 1 vector of integers \(\mathbf{w}\). Now, consider the matrix \(\mathbf{R}\), where \(\mathbf{R}\) is formed by taking \(\mathbf{A_i}\), that is the i-th row of \(\mathbf{A}\), and repeating it \(\mathbf{w_i}\) times. This new matrix \(\mathbf{R}\) has dimension s by n, where
\[\displaylines{s = \sum_{i=1}^{m}{\mathbf{w_i}}}\ .\]
If \(s >> m\), then it is undesirable to compute the full matrix \(\mathbf{R}\) and perform principal component analysis (PCA) on it. Instead, the highly structured form of \(\mathbf{R}\), suggests there should be a more efficient method to perform this decomposition. This method is known as weighted PCA and is the topic of this post.Tags: Data Science, Machine Learning, Mathematics, Statistics
ICP In Practice
Sat, 29 May 2021
This post explores the iterative constrained pathways rule ensemble (ICPRE) method introduced in an earlier post using the Titanic dataset popularized by Kaggle [1]. The purpose of the text is to introduce the features and explore the behavior of the library.
Some of the code snippets in this post are shortened for brevity sake. To obtain the full source and data, please see the ICPExamples GitHub page [2].
Tags: Computer Science, Data Science, Data Visualization, Machine Learning, Python, Statistics
The Iterative Constrained Pathways Optimizer
Tue, 18 May 2021
Many optimization methods seek an optimal parameter set with regard to error or likelihood. Such a solution is most desirable in many regards. However, when the broader context of a problem is included, the indisputable superiority of the optimum frequently becomes less clear. This context often includes other guidelines and restrictions that may limit the usefulness of solutions lacking certain properties. Unfortunately, typical loss criteria can rarely take these into account.
This blog post presents a method that abandons the quest for optimality and instead focuses on better satisfying the broader context of a problem. It describes a method that does not attempt to find the minimum, but instead simply tries to get closer to it while respecting imposed constraints. This blog post describes the iterative constrained pathways optimizer.
Tags: Computer Science, Data Science, Machine Learning, Mathematics, Statistics
Simulated Genetic Drift in Populations
Sat, 20 Feb 2021
This video shows a simulation of genetic drift in a synthetically generated population as a result of sexual reproduction. A fixed population size is divided into different distinct sub-populations with differing allele frequencies. Starting with an initial population, 80 simulated epochs are passed in which each population member is replaced via sexual reproduction from two randomly selected parents. Pairs of parents are chosen such that the probability they come from the same sub-population is higher than the probability that they from come different sub-populations.
Figure 1: Simulated Genetic Drift in Populations
In the animation, the high-dimensional allele features for each population member are represented in two dimensions using PCA. The size and color of each marker encodes information about sub-population makeup and may be used to help distinguish highly mixed samples.Although the data is entirely synthetic, it demonstrates the middling affect that cross-breeding has on the genetic makeup of the overall population. As the number of sub-populations grows and the overall population size remains fixed, the impact of cross-breeding is intensified and the population as a whole converges more rapidly.
Tags: Bioinformatics, Data Science, Data Visualization, Genetics, Genomics
CoV-2 Genome Explorer
Fri, 05 Feb 2021
At the time of this writing, NCBI Virus has over 40,000 complete CoV-2 sequences available. I made an interactive webpage to help visualize a random subset of these genomes using principal component analysis.
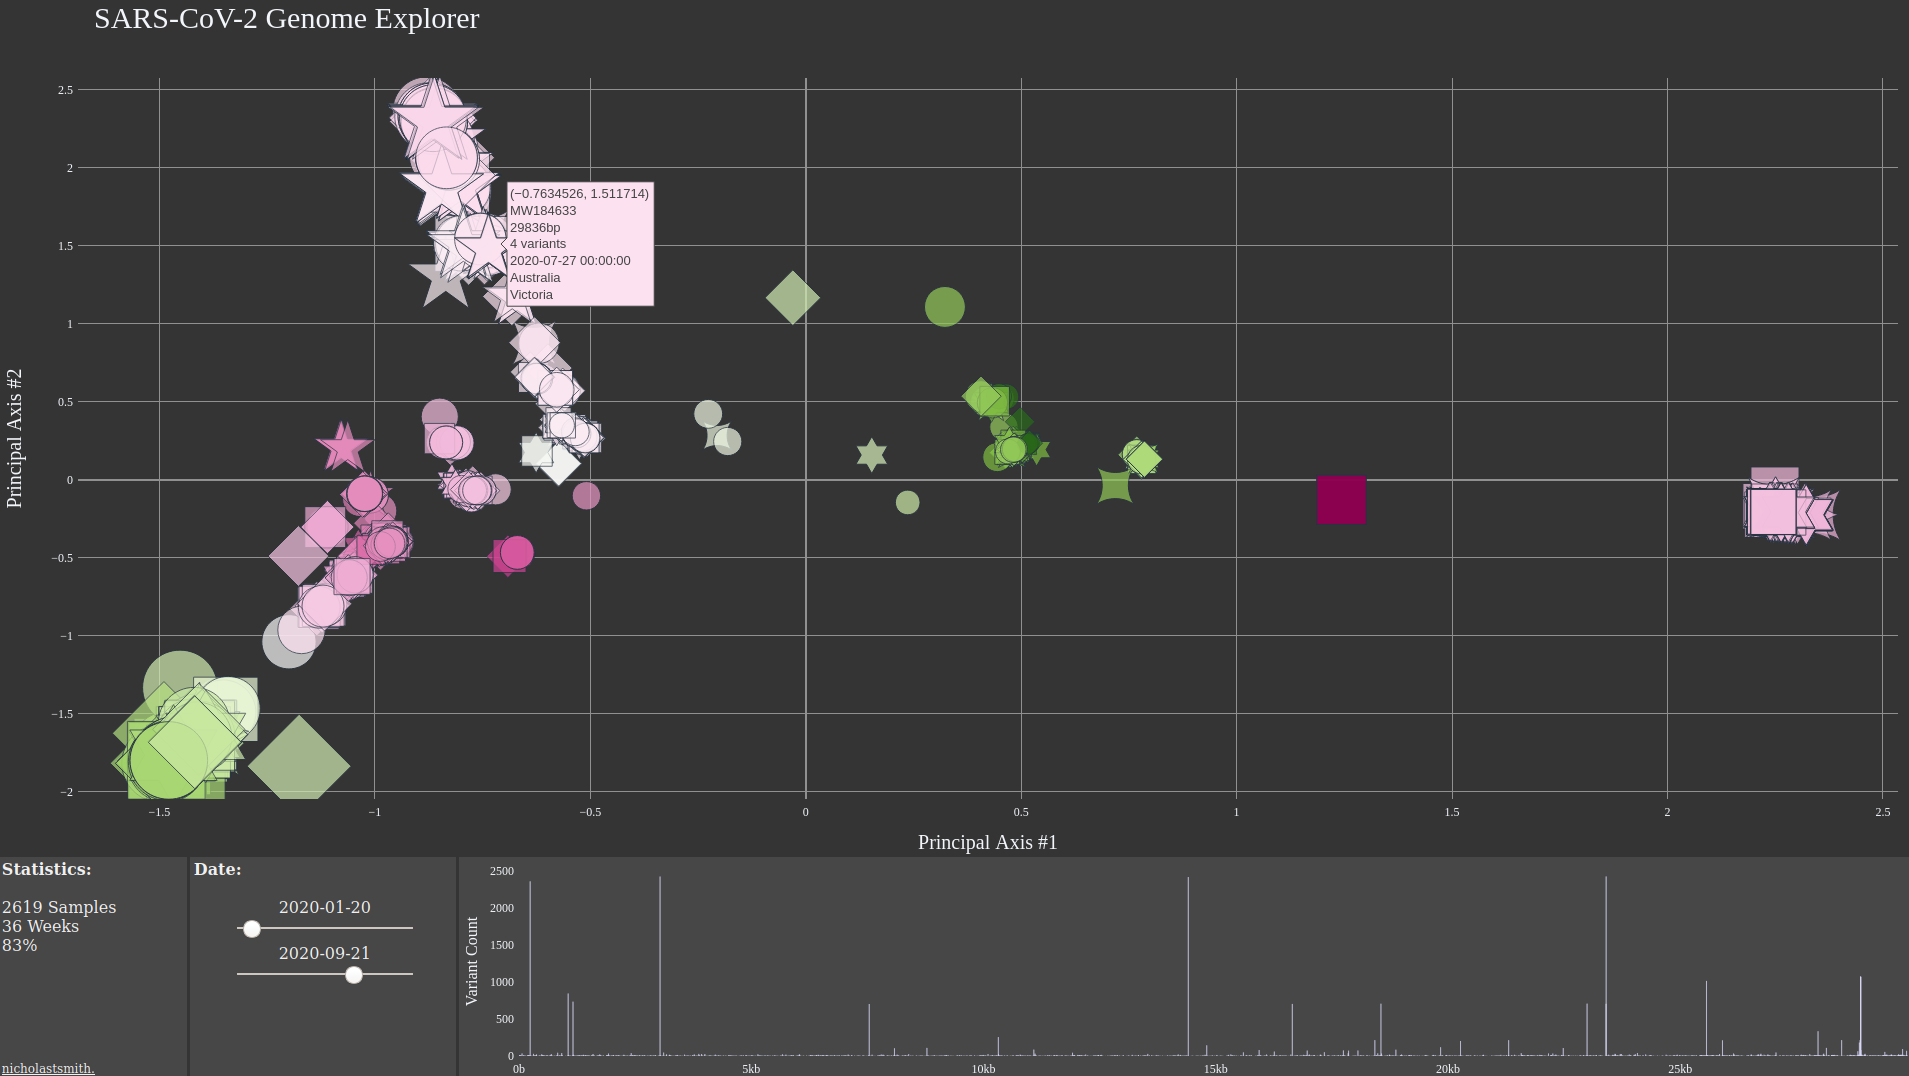
Figure 1: CoV-2 Explorer Interface
The x, y, size, and color axes respectively represent the first four principal axes. The plot markers identify viruses with unique nucleotide sequences in the GU280_gp02 (spike glycoprotein) gene region. The range sliders can be used to visualize shift in the viral genomes over time. The bar chart in the bottom right counts the frequency of SNP mutations in the sequences present in the specified date range.Tags: Cov-2, Covid-19, Data Visualization, Genome Sequencing, Genomics
Ancestry Determination Part 3: openSNP Data Evaluation
Tue, 26 Jan 2021
The website openSNP allows users to share and discuss genetic information [1]. The purpose of the site is perhaps best summarized by its bio on Twitter: "crowdsourcing genome wide association studies" [2]. This post uses the machine learning and statistical techniques developed in previous blog entries to analyze the ancestry of openSNP members who have genotyping data associated to their accounts. By comparing the derived results with the self-reported answers from openSNP users, the accuracy of these methods on real-world data is assessed.
Tags: Ancestry, Bioinformatics, Data Science, Data Visualization, Genetics, Genomics, Machine Learning
Identifying Family Relationships using Genetic Similarity Measures
Sat, 02 Jan 2021
In general, are parents more genetically similar to their children or to their siblings? Why do some siblings look alike while others look completely different? How can the genetic similarity between two individuals be computed? This post uses biostatistics to explore genetic similarity and tries to answer these and other questions.
Tags: Bioinformatics, Computer Science, Data Science, Data Visualization, Family, Genetics, Genomics, Machine Learning, Statistics
Decorrelation Redux
Sat, 26 Dec 2020
Consider the typical statement of the least squares problem.
\[\displaylines{\mathbf{A}\mathbf{x}=\mathbf{y}}\ ,\]
where \(\mathbf{A}\) is the m x n data matrix, \(\mathbf{x}\) is the n x 1 vector of regression coefficients, and \(\mathbf{y}\) is the m x 1 vector of target values.Tags: Data Science, Mathematics, Statistics
Analysis of the Preliminary 2020 Election Results
Sat, 14 Nov 2020
The 2020 general election in the U.S.A. is interesting in several regards. Perhaps chief among these is the influence of the COVID-19 pandemic on voting patterns and the subsequent shift to more reliance on mail-in voting. This post presents analysis of the preliminary election results and attempts to explain some of the observed trends.
Tags: Data Science, Data Visualization, Election, Election2020, Statistics, Voting
Analysis of the 2016 US General Election
Wed, 21 Oct 2020
Counties within the United States vary substantially along a number of demographic and socioeconomic axes. These factors explain much of the variation observed throughout the US with respect to election and polling trends. This post attempts to untangle some of this complexity to give insight into the factors that influence voter behavior and other broader national trends.
Tags: Data Science, Data Visualization, Economics, Election, Voter Turnout, Voting
The United States by County
Sun, 11 Oct 2020
This post explores the composition of the United States using choropleth charts. The statistics and other values represented are as of the year 2016. Percentage changes in the number of democratic and republican voters are computed between the years 2008 and 2016.
Tags: Data Visualization, Demographics, Election
The Atlantic Hurricane Season: 120 Years
Thu, 08 Oct 2020
The following plot shows the number of tropical storms and major hurricanes occurring during each of the past 120 Atlantic hurricane seasons.
Tags: 2020, Data Visualization, Hurricane Delta, Hurricanes
The Shooting Regressor; Randomized Gradient-Based Ensembles
Wed, 16 Sep 2020
Gradient boosting stands apart from many other supervised learning approaches in some regard. It is an ensemble method, However, the ensemble is constructed sequentially. It estimates a target value. But, it does so indirectly through the gradient.
Tags: Computer Science, Data Science, Machine Learning, Mathematics, Statistics
Precipitation Totals by City in the USA
Fri, 19 Jun 2020
The following plots show the average amount of precipitation over the past 70 years for 8 cities in the USA. Each sub-image depicts a hypothetical calendar month and each colored square in a sub-image depicts a single day. The color of a given square describes the amount of precipitation a city receives for the day corresponding to that square on average.
Tags: Data Visualization, Statistics, Weather
Ancestry Determination via Genetic Variant Analysis Part 2
Mon, 18 May 2020
In this post, the techniques outlined in an earlier blog post are employed to predict the ancestry of the author. Two approaches are considered: an approach using a classification model and one using similarity functions. Finally, scatter plots depicting low dimensional projections of the data are shown, plotting the genome of the author alongside samples from the IGSR dataset.
Tags: Bioinformatics, Data Science, Data Visualization
My Experience with Whole Genome Sequencing
Sun, 17 May 2020
So, I decided to have my genome sequenced.
Tags: Free-Form
Visualizing Coronavirus Phylogenies with Genome Mutation Analysis
Sun, 26 Apr 2020
In this post, the severe acute respiratory syndrome coronavirus 2 (SARS-CoV-2) responsible for the recent pandemic is analyzed. Several attributes about the presently recorded virus genomes are plotted and genetic mutations in the sequences are traced to identify probable phylogenies among the samples.
Tags: Bioinformatics, Coronavirus, Covid-19, Data Science, Data Visualization, Medicine
Ancestry Determination via Genetic Variant Analysis
Sat, 18 Apr 2020
Introduction
Sequencing of the human genome began in 1990 as part of the Human Genome Project. With the technology available at the time, the project was a substantial undertaking. The human genome contains two sets of 23 chromosomes each with roughly 3.2 billion base pairs. A number of institutions, in countries around the world, participated in the project. Thirteen years later the project was complete at a cost of roughly three billion US dollars. The result was the first reference human genome.Rapid advances in the field of genomics have dramatically lowered the cost of genetic sequencing and have ushered in the age of the once fabled "$1000 genome." Now, a growing list of companies offer whole genome sequencing for hundreds of dollars with turn around time measured in weeks. This technology enables introspection into the sequences of nucleobases that comprise DNA and thus the genes of anyone curious enough to take the plunge.
Tags: Ancestry, Bioinformatics, Data Science, Genome Sequencing, Medicine, Snp, Statistics
CoVID-19 Projections using Kernel SVR and Death Rate Analysis
Sun, 05 Apr 2020
Updated April 8th 2020
I've spent a disturbing amount of time trying to come up with a decent model for the CoVID-19 pandemic. The big challenge is how little good data there is. Pretty much all available data is riddled with confounding variables and bias. There is a long list of challenges but some I find most daunting are that:
Tags: Covid-19, Data Science, Data Visualization, Statistics
Flu/Pneumonia Deaths by Month in 2017 in the US
Tue, 24 Mar 2020
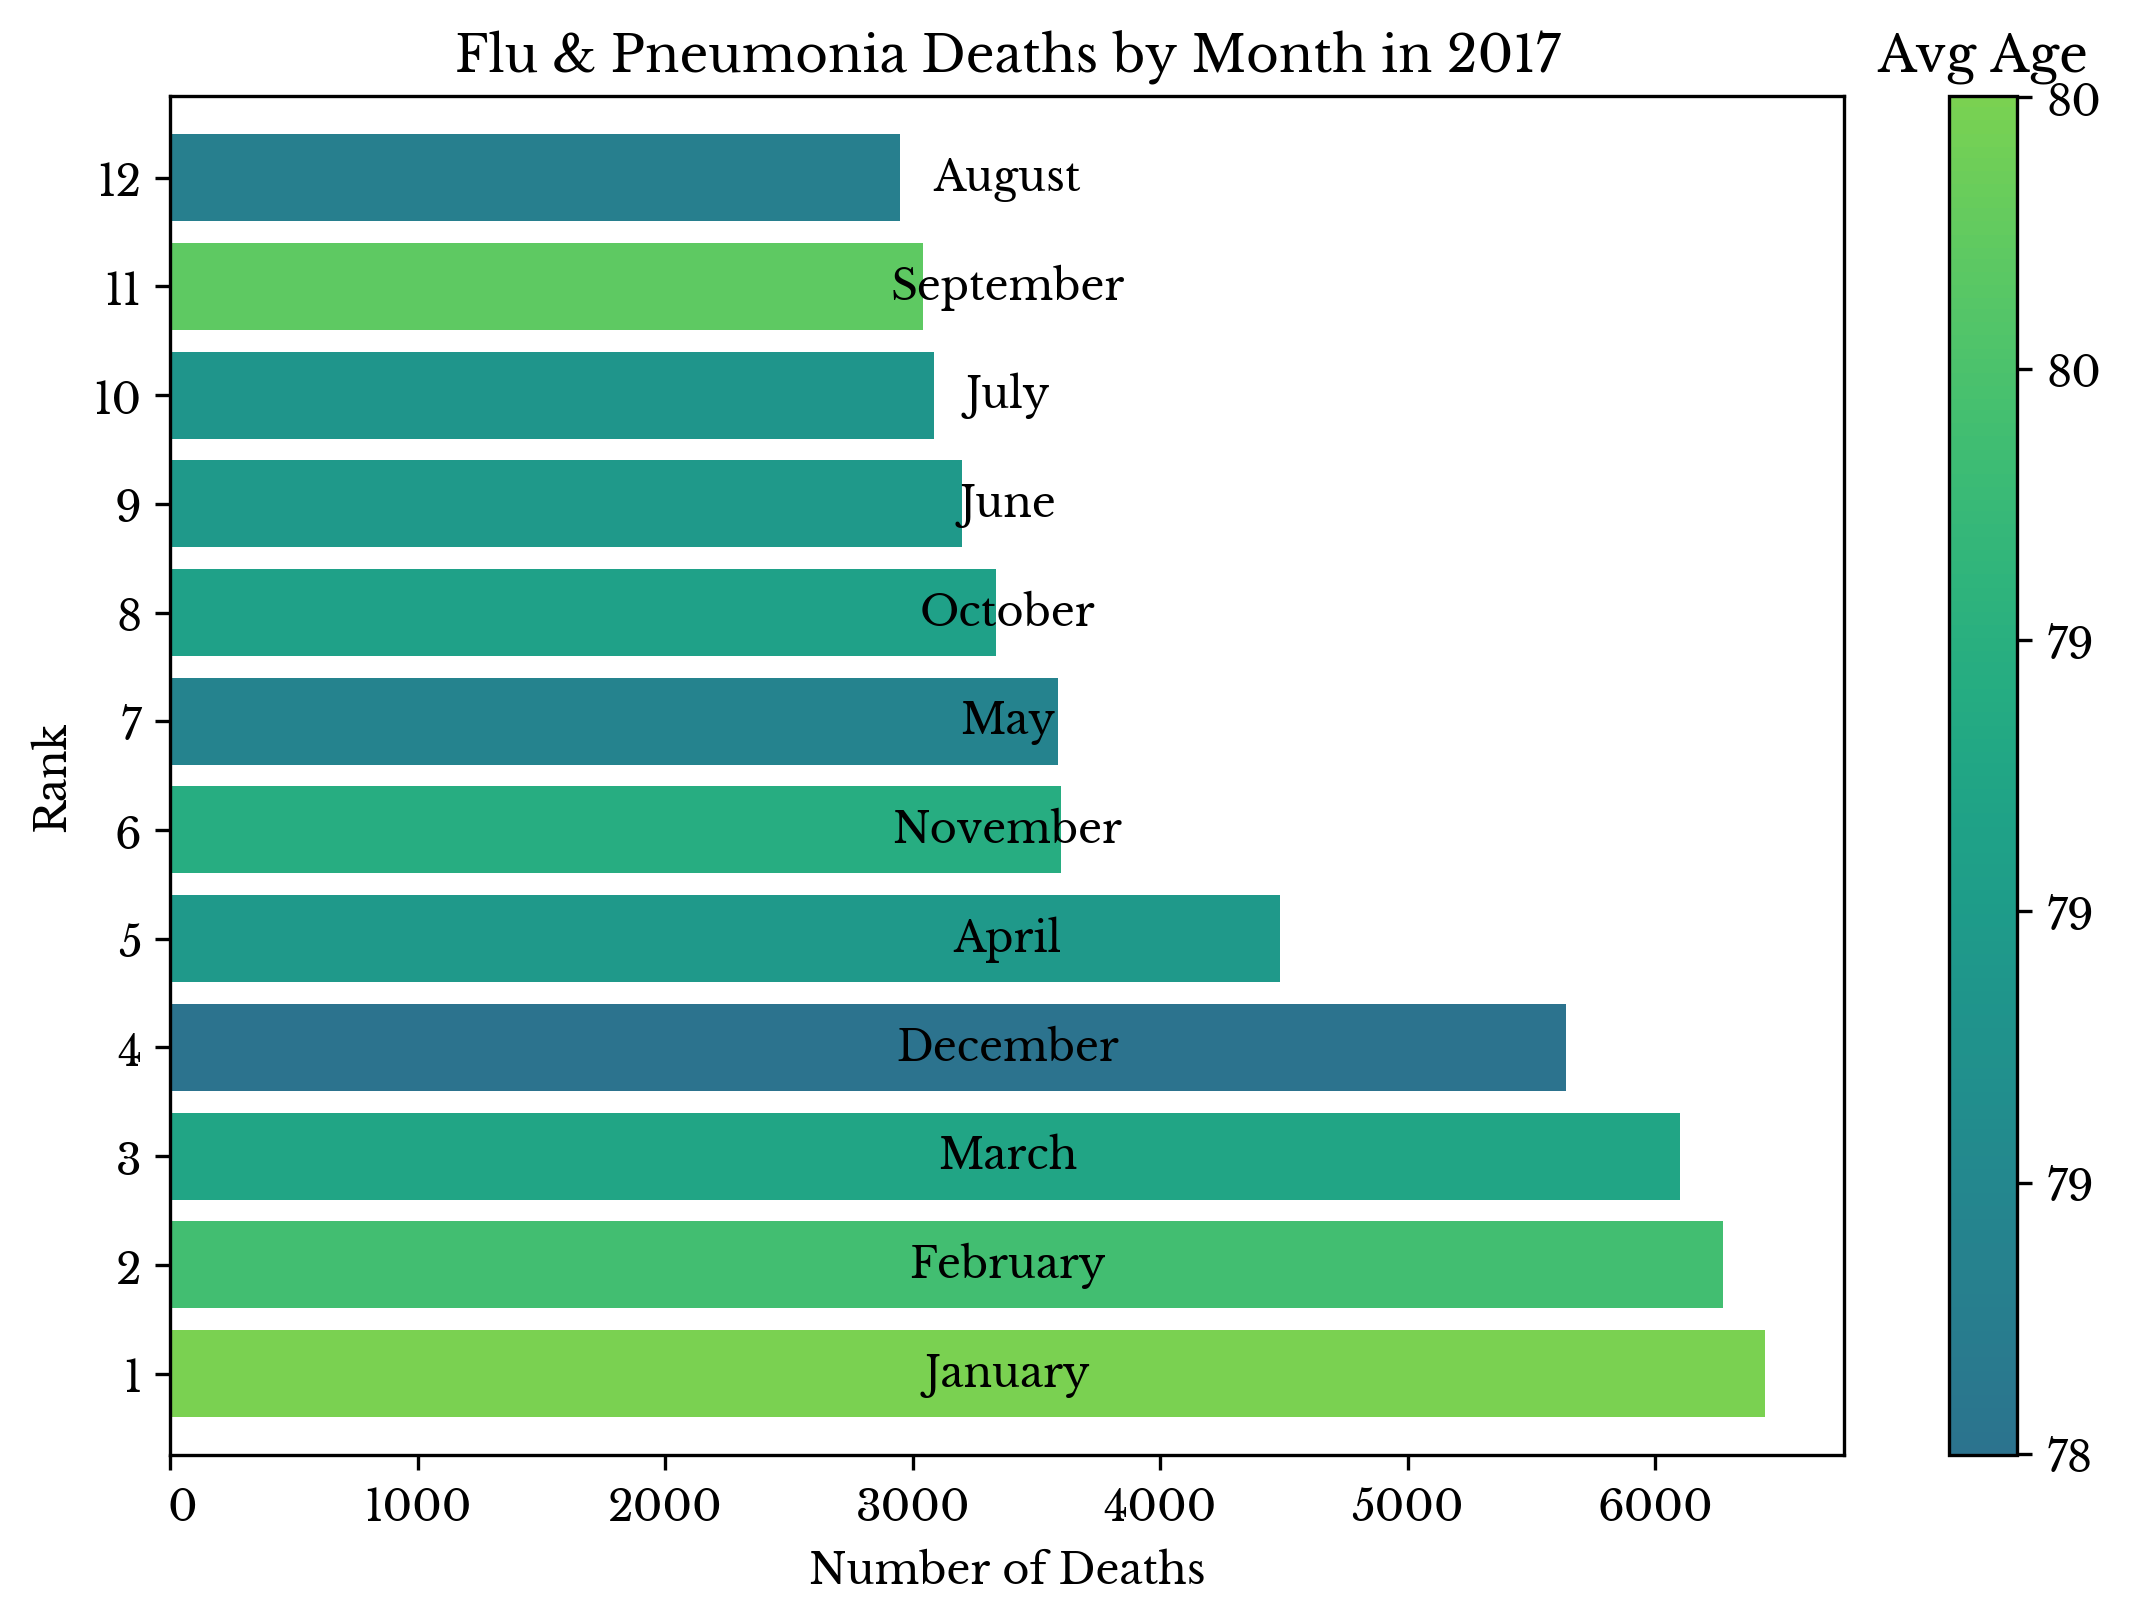
Note: The data in this chart is taken from the National Center for Health Statistics on CDC's website.
Tags: Coronavirus, Covid-19, Data Science, Data Visualization, Influenza, Image
Population Normalized CoVID-19 Charts and Predictions
Sun, 22 Mar 2020
The following charts compare the number of deaths resulting from the CoVID-19 pandemic in various countries as of March 20th 2020. The daily totals are normalized by the population in each country to produce per capita numbers. Per capita numbers allow for more easy comparison between countries.
Tags: Coronavirus, Covid-19, Data Science, Data Visualization, Medicine
On the Influence of Recessions on the S&P 500 Index
Sat, 21 Mar 2020
The following plots explore the influence of two economic factors during recessions on the S&P 500 index: unemployment and gross domestic product (GDP). A linear model is constructed to predict the low of the S&P 500 index during a given recession using two transformed variables derived from the maximum unemployment and GDP differentials for that recession.
Tags: Data Science, Data Visualization, Economics, Statistics
Sunrise and Sunset Times by City
Sun, 04 Aug 2019
The following plots show the amount of daylight, sunrise time, and sunset time for four US cities throughout the year of 2019.
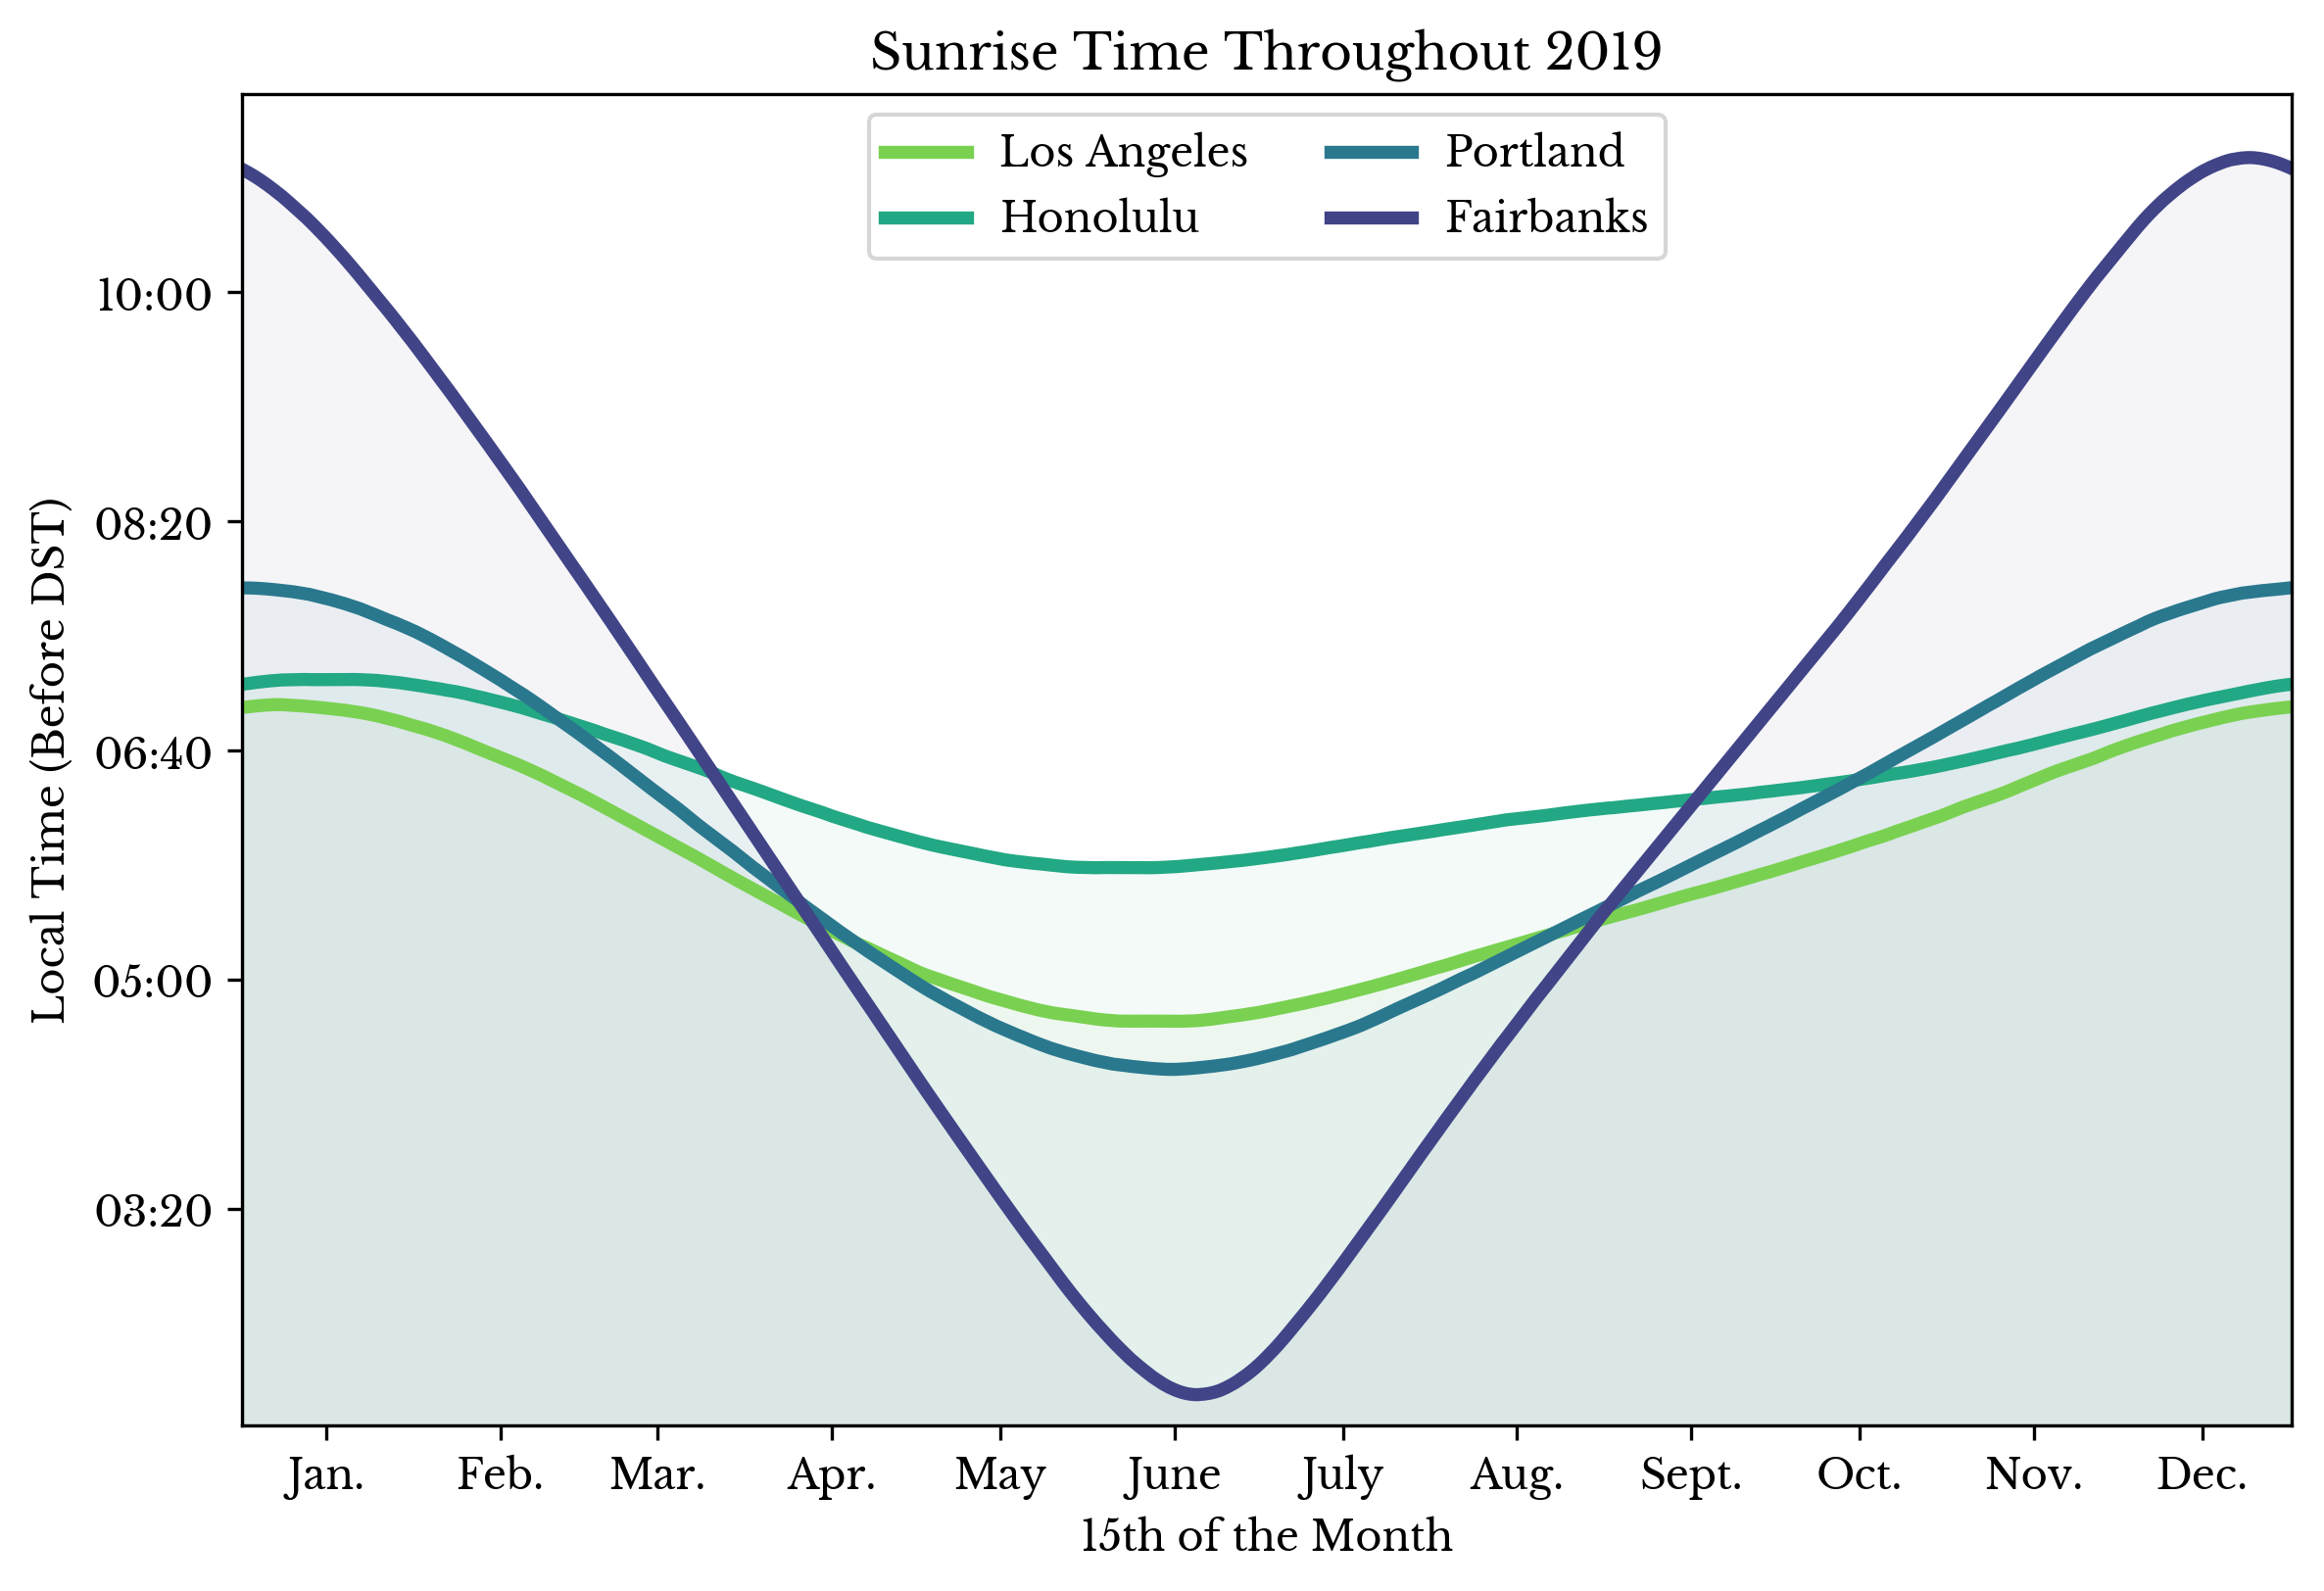 | 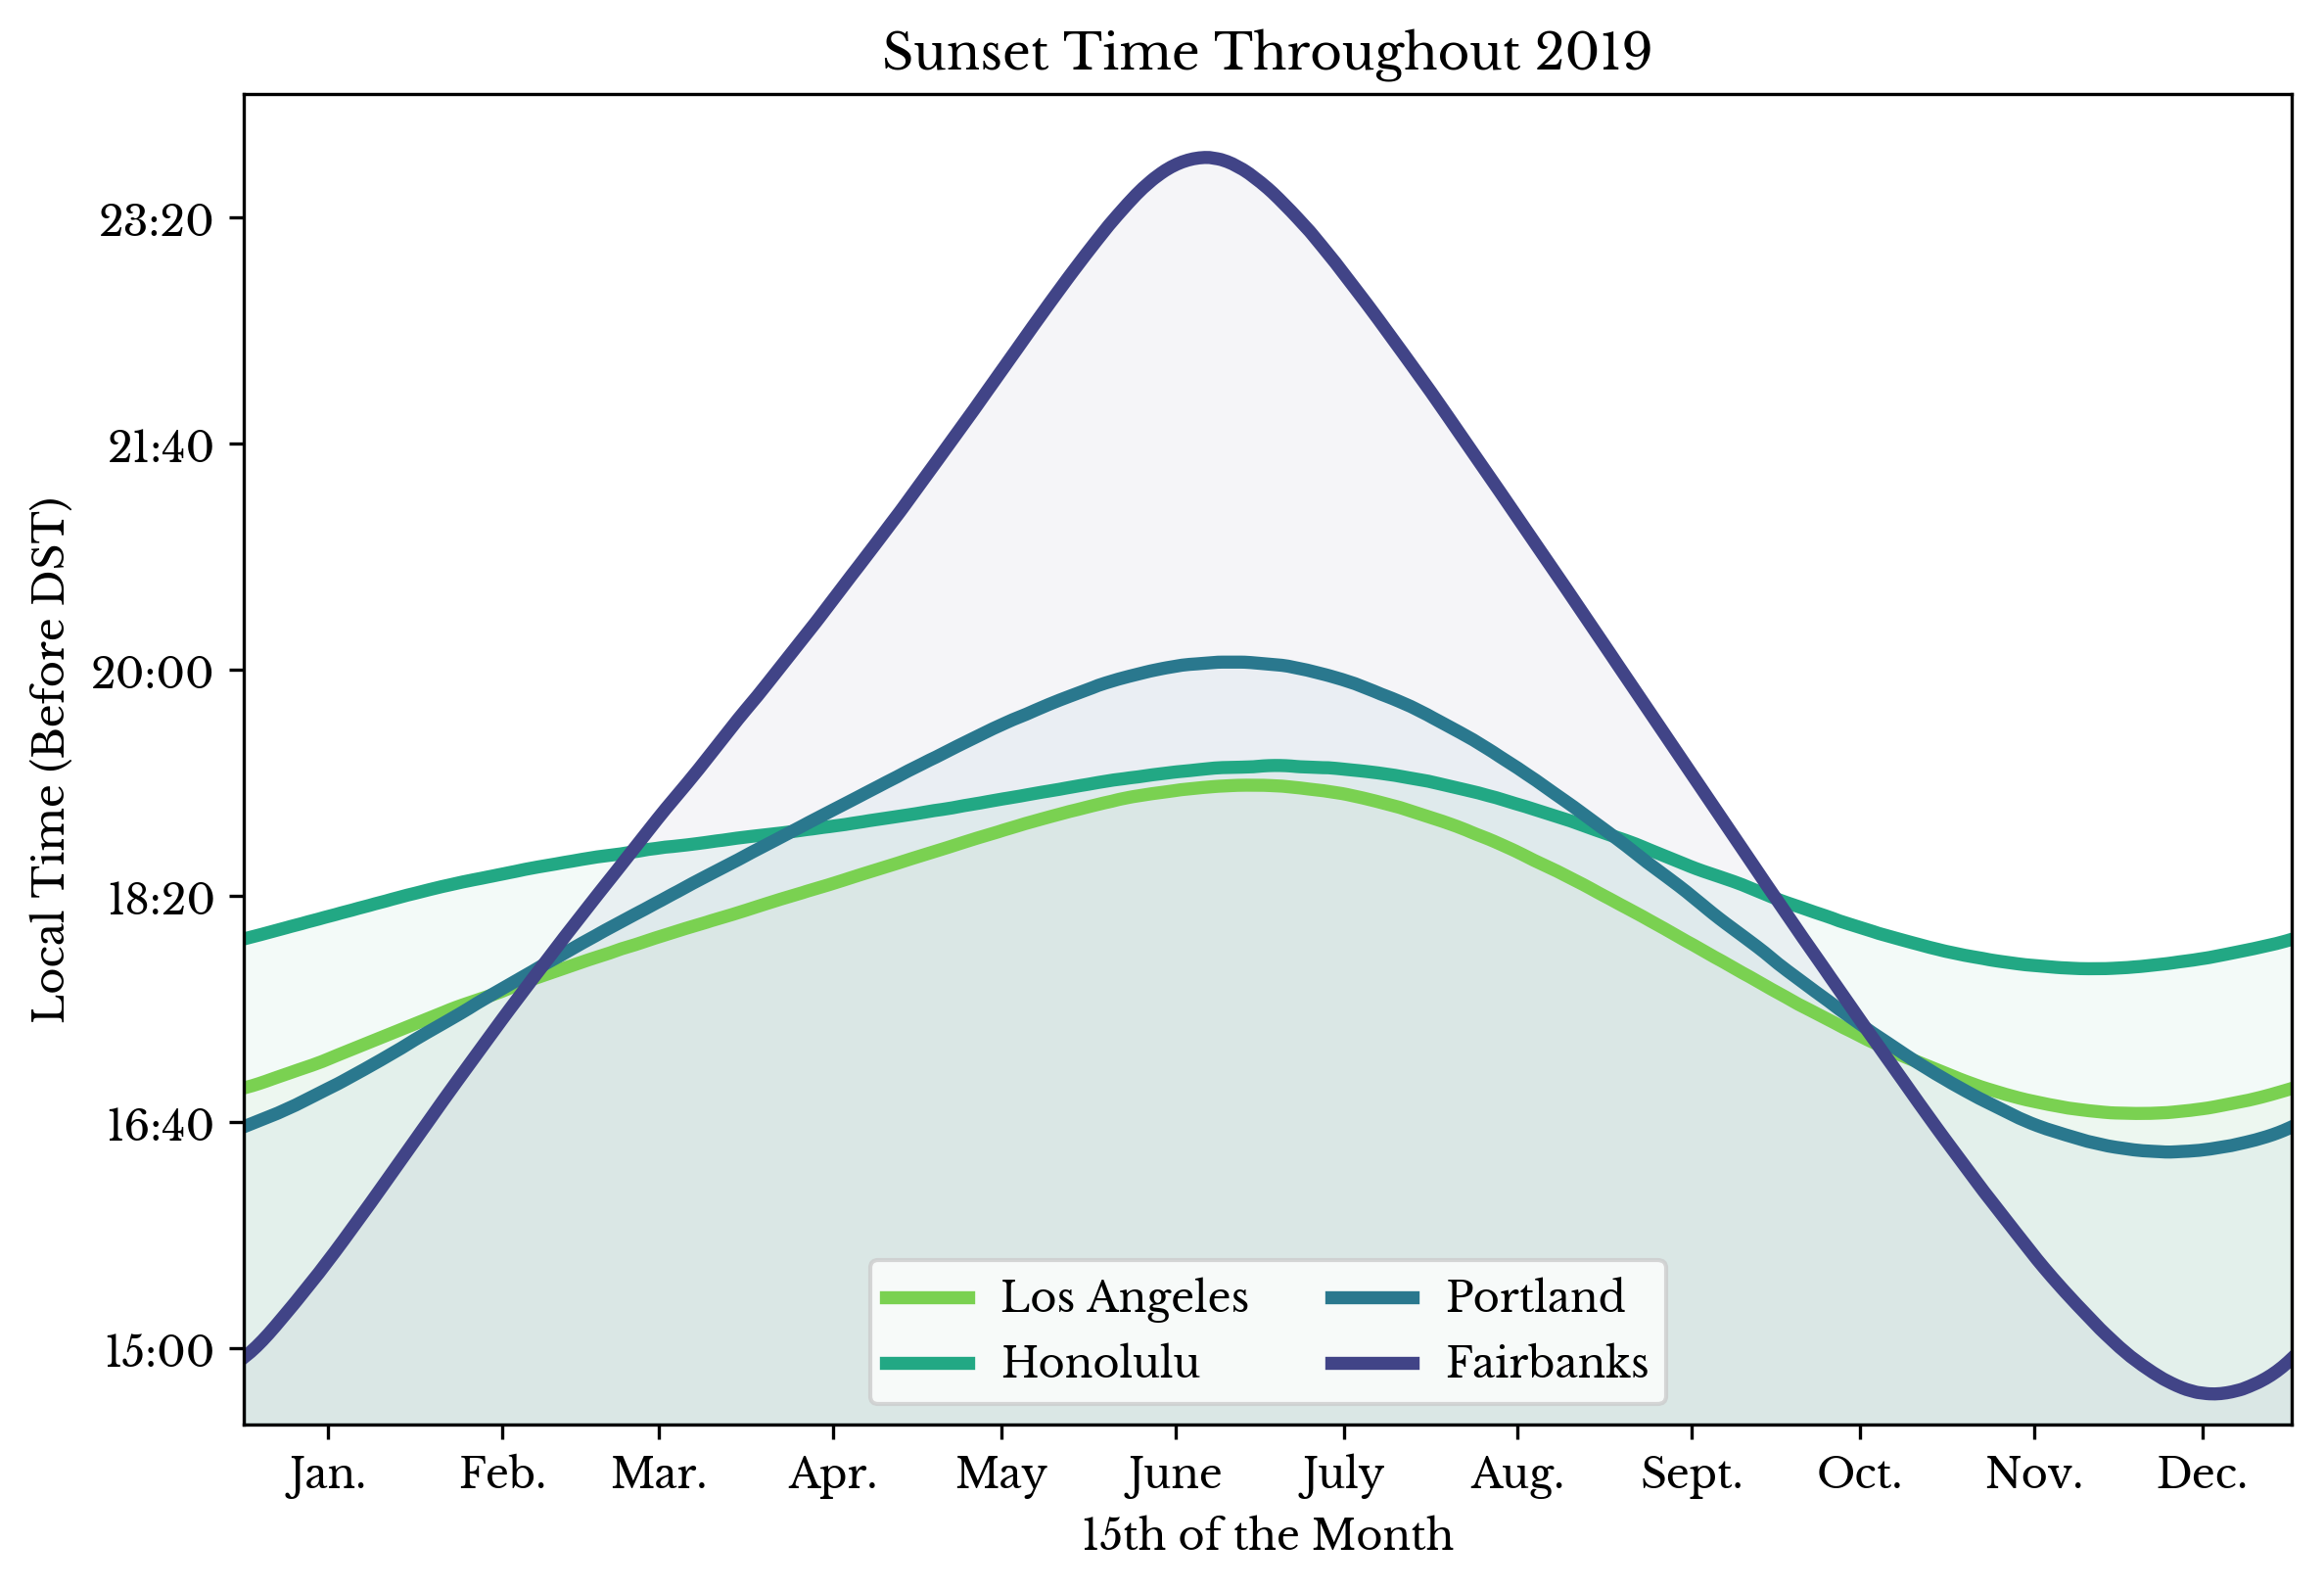 | 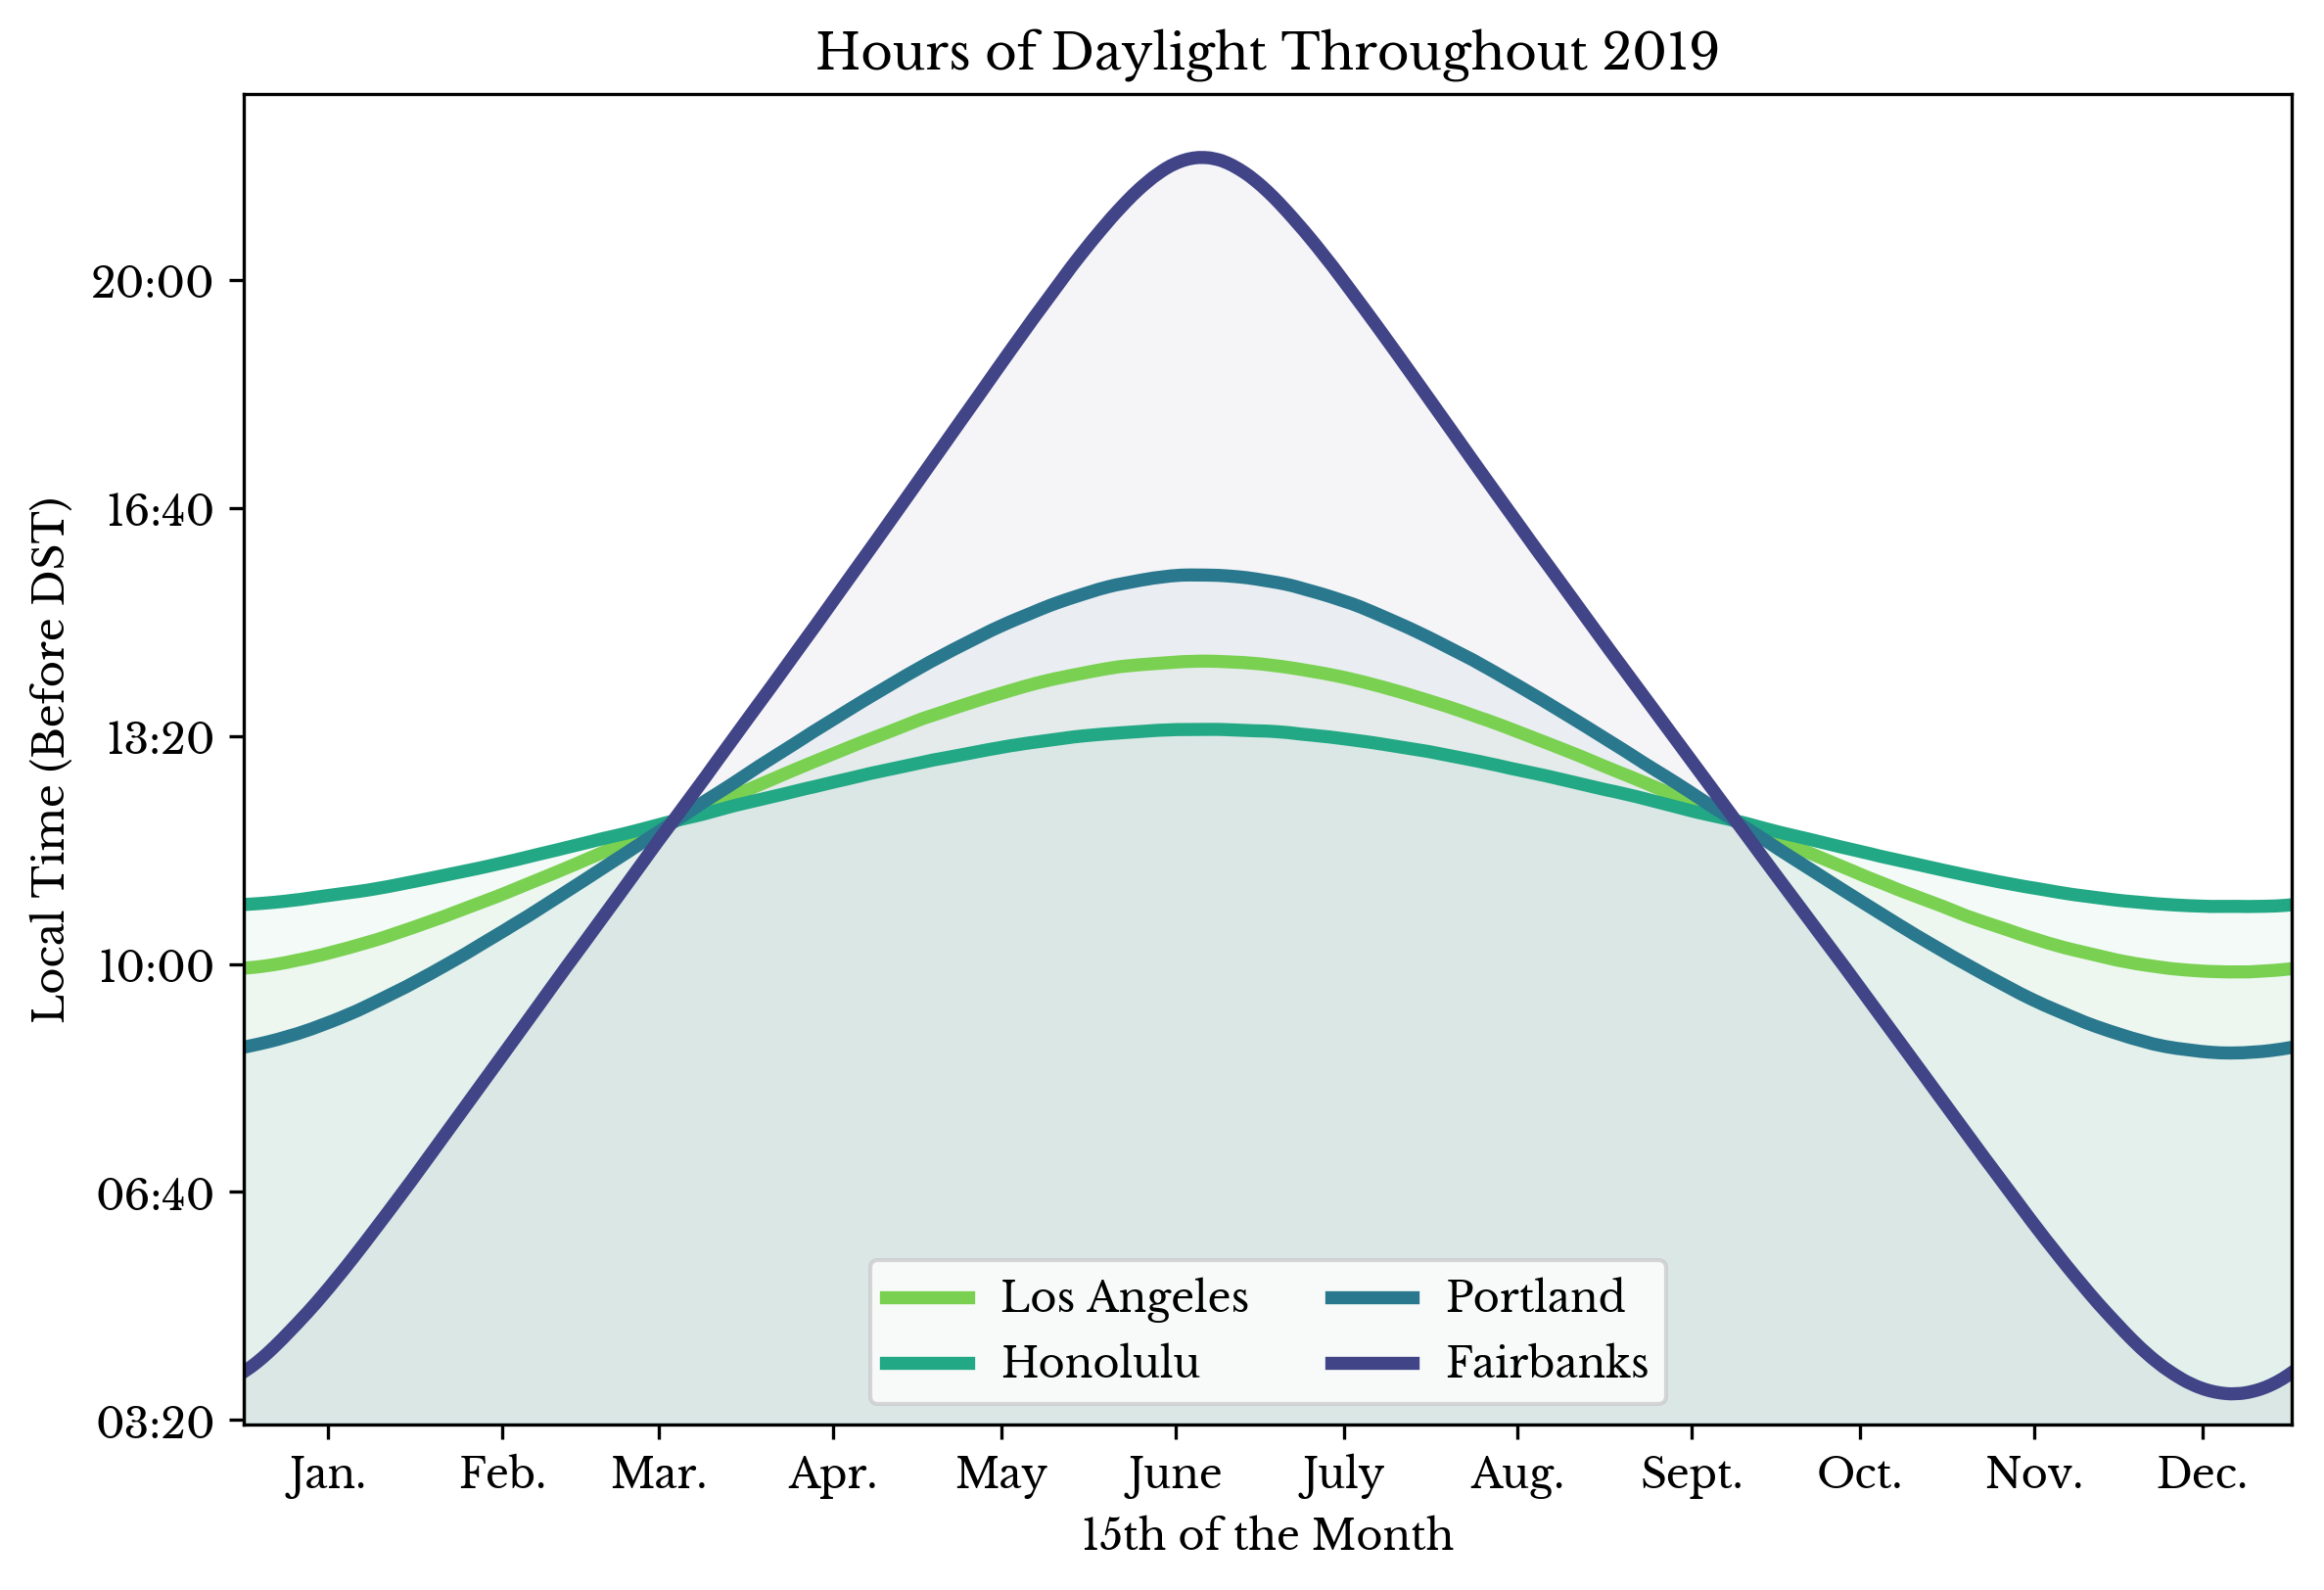 |
Figure 1: Hours of Daylight, Sunrise Time, and Sunset Time by City
The rise and set times are shown in local time without adjustment for daylight saving times (DST). Data obtained from the U.S. Naval Observatory Astronomical Applications Department.
Tags: Astronomical Data, Data Visualization, Sunrise, Sunset, Weather
RangeMap: A Simple Interval Query Datastructure
Thu, 04 Jul 2019
Maps are a fundamental data structure. Their prevalence is a testament to their importance. Indeed, many search problems can be reduced to the construction of an appropriate map. However, a search problem occasionally arises that is difficult to solve, at least directly, with a map. The interval query problem is one such problem.
Tags: Algorithms, C++, Computer Science, Interval Query, Software
Visualizing International Trade of Food Products
Sat, 12 Jan 2019
With the rise of globalization, countries increasingly trade food products internationally. Acting in their own economic interests, countries buy and sell food where profitable, much like any other product. Import and export records provide a fascinating window into this complex world of international food trade.
Tags: Data Visualization, Economics, Food, International Trade
Applying Correlation as a Criterion in Hierarchical Decision Trees
Thu, 27 Dec 2018
Decision trees are a simple yet powerful method of machine learning. A binary tree is constructed in which the leaf nodes represent predictions. The internal nodes are decision points. Thus, paths from the root to the leafs represent sequences of decisions that result in an ultimate prediction.
Decision trees can also be used in hierarchical models. For instance, the leafs can instead represent subordinate models. Thus, a path from the root to a leaf node is a sequence of decisions that result in a prediction made by a subordinate model. The subordinate model is only responsible for predicting samples that fall within the leaf.
This post presents an approach for a hierarchical decision tree model with subordinate linear regression models.
Tags: Cython, Data Science, Decision Tree, Machine Learning, Scikit-Learn, Statistics
A Method for Addressing Nonhomogeneous Data using an Implicit Hierarchical Linear Model
Sat, 27 Oct 2018
Datasets containing nonhomogenous groups of samples present a challenge to linear models. In particular, such datasets violate the assumption that there is a linear relationship between the independent and dependent variables. If the data is grouped into distinct clusters, linear models may predict responses that fall in between the clusters. These predictions can be quite far from the targets depending on how the data is structured. In this post, a method is presented for automatically handling nonhomogenous datasets using linear models.
Tags: Computer Science, Data Science, Linear Algebra, Linear Models, Machine Learning, Mathematics, Research, Statistics
Decorrelating Features using the Gram-Schmidt Process
Thu, 04 Oct 2018
A problem that frequently arises when applying linear models is that of multicollinearity. The term multicollinearity describes the phenomenon where one or more features in the data matrix can be accurately predicted using a linear model involving others of the features. The consequences of multicollinearity include numerical instability due to ill-conditioning, and difficulty in interpreting the regression coefficients. An approach to decorrelate features is presented using the Gram-Schmidt process.
Tags: Data Science, Linear Algebra, Linear Models, Machine Learning, Mathematics, Statistics
TVLib: A C++ Text Vectorization Library with Python Bindings
Mon, 09 Jul 2018
I am a big fan of the CountVectorizer class in scikit-learn [1]. With a robust and easy interface that produces (sparse!) matrices, what’s not to love? Well, it’s… pretty… slow…
The performance is okay for 10s of MB of text, but GBs take minutes or more. It terms out that CountVectorizer is implemented in pure Python. The functions are single threaded too. It seems like low-hanging fruit. Just whip up some parallel C++, right? Well, not quite, but I’m getting ahead of myself.
Tags: C++, Computer Science, Data Science, Machine Learning, Nlp, Python, Sklearn, Software, Sparse Matrices
On the Analysis and Prediction of Recessions in the USA
Sat, 23 Jun 2018
This chapter explores recessions in the United States of America. Datasets are collected from a variety of locations including the Federal Reserve Economic Data (FRED) and from the website of Yale professor and Nobel laureate Dr. Robert J. Shiller. A classifier model is constructed which predicts recessions and this model is analyzed for useful insights.
Tags: Data Science, Data Visualization, Economics, Machine Learning, Statistics, Stocks
Real S&P Composite Moving Average
Sat, 16 Jun 2018
Recently, I have been experimenting with windowing functions for time series data. While trying out my code, I came up with a nice and (somewhat) thought-provoking plot.
Tags: Data Science, Data Visualization, Economics, S&P, Statistics, Stocks
A Brief Analysis of Survey Data from a Speed Dating Event
Sat, 05 May 2018
In this post, survey data collected from several speed dating events is analyzed. The events were conducted between 2002 and 2004 by two professors from Columbia University: Ray Fisman and Sheena Iyengar. In addition to questions about personal interests, the survey includes academic and occupational questions as well.
Tags: Data Science, Data Visualization, Human Behavior, Statistics
Malware Detection and Classification using Logistic Regression
Mon, 02 Apr 2018
In this post, an approach to detecting malware using machine learning is presented. System call activity is processed and analyzed by a classification model to detect the presence of malicious applications.
Tags: Anti-Virus, Computer Science, Data Science, Machine Learning, Malware, Security, Windows
A Look at Stack Overflow Questions about Python
Mon, 05 Mar 2018
There is a dataset on Kaggle that contains questions taken from Stack Overflow about the Python programming language. This post briefly explores portions of the dataset.
Tags: Computer Science, Data Science, Data Visualization, Python, Software, Stack Overflow, Wordcloud
Mortality in the United States and Its Causes
Sat, 24 Feb 2018
In this chapter, vital statistics for the United States of America are explored. The Center for Disease Control maintains several datasets containing vital statistics for the nation. These datasets contain records of deaths organized by year. Each record includes age, gender, race, cause of death, and other details. This chapter explores data for the year 2016.
Tags: Data Science, Data Visualization, Death, Medicine, Statistics
On Forename Popularity in the USA
Fri, 19 Jan 2018
In this chapter, forenames in the USA are considered. The United States Social Security Administration (SSA) makes available a dataset containing information about Social Security records. The dataset contains counts of the number of records that exist for a specific first name and birth year.
Tags: Data Science, Data Visualization, Name Popularity, Statistics
A Statistical Analysis of Facial Attractiveness
Tue, 02 Jan 2018

Does beauty truly lie in the eye of its beholder? This chapter explores the complex array of factors that influence facial attractiveness to answer that question or at least to understand it better.
Tags: Data Science, Data Visualization, Facial Attractiveness, Machine Learning, Statistics
Visualizing Bitcoin Wealth Distribution
Wed, 27 Dec 2017
This post explores the distribution of wealth among nonempty addresses on the Bitcoin network.
All addresses on the Bitcoin network are queried. The number of addresses with at least one satoshi is 24,473,765 at the time of the query. The resulting addresses are sorted by the amount of Bitcoin they contain. The list is divided into quantiles and the wealth of each quantile is plotted in a bar plot.
Tags: Bitcoin, Cryptocurrency, Data Science, Data Visualization, Statistics
Binary Classification with Artificial Neural Networks using Python and TensorFlow
Sat, 09 Dec 2017
This post is an introduction to using the TFANN module for classification problems. The TFANN module is available here on GitHub. The name TFANN is an abbreviation for TensorFlow Artificial Neural Network. TensorFlow is an open-source library for data flow programming. Due to the nature of computational graphs, using TensorFlow can be challenging at times. The TFANN module provides several classes that allow for interaction with the TensorFlow API using familiar object-oriented programming paradigms.
Tags: Classification, Computer Science, Data Science, Data Visualization, Machine Learning, Python, Tensorflow
What is a Bitcoin Worth, Anyway?
Thu, 26 Oct 2017
Is the recent surge in Bitcoin's price a speculative bubble?
By definition, an economic bubble is a situation in which an asset is traded within a price range that far exceeds its intrinsic value. So, the question is: what is the intrinsic value of Bitcoin? The purpose of this post is to explain some of the technical details of Bitcoin so as to gain a better idea of its value.
Tags: Bitcoin, Computer Science, Cryptocurrency, Hashing, Security
Deep Learning OCR using TensorFlow and Python
Sat, 14 Oct 2017
In this post, deep learning neural networks are applied to the problem of optical character recognition (OCR) using Python and TensorFlow. This post makes use of TensorFlow and the convolutional neural network class available in the TFANN module. The full source code from this post is available here.
Tags: Computer Science, Data Science, Deep Learning, Machine Learning, Ocr, Python, Tensorflow
Introducing: Deep Learning Deathmatch TV
Wed, 13 Sep 2017
This post is made in introduction of a new YouTube series titled Deep Learning Deathmatch. In this series, a deep learning based AI that relies only on visual input is pitted against video game bosses. The resulting battle is recorded, edited, and compiled into a video. In the first video in the series, the AI fights the Oasis boss in Path of Exile.
More videos are available on my YouTube channel.
Tags: Computer Science, Deep Learning, Gaming, Machine Learning, Neural Networks, Path Of Exile
PoE AI Part 5: Real-Time Obstacle and Enemy Detection using CNNs in TensorFlow
Sat, 26 Aug 2017
This post is the fifth part of a series on creating an AI for the game Path of Exile © (PoE).
- A Deep Learning Based AI for Path of Exile: A Series
- Calibrating a Projection Matrix for Path of Exile
- PoE AI Part 3: Movement and Navigation
- PoE AI Part 4: Real-Time Screen Capture and Plumbing
- AI Plays Path of Exile Part 5: Real-Time Obstacle and Enemy Detection using CNNs in TensorFlow
Tags: Ai, Computer Science, Data Science, Deep Learning, Gaming, Machine Learning, Path Of Exile
Using Random Forests and Wordclouds to Visualize Feature Importance in Document Classification
Thu, 17 Aug 2017
What characteristics do the works of famous authors have that make them unique? This post uses ensemble methods and wordclouds to explore just that.
Tags: Computer Science, Data Science, Data Visualization, Machine Learning, Matplotlib, Nlp, Python, Random Forest, Wordcloud
PoE AI Part 4: Real-time Screen Capture and Plumbing
Fri, 11 Aug 2017
This post is the forth part of a series on creating an AI for the game Path of Exile © (PoE).
- A Deep Learning Based AI for Path of Exile: A Series
- Calibrating a Projection Matrix for Path of Exile
- PoE AI Part 3: Movement and Navigation
- PoE AI Part 4: Real-Time Screen Capture and Plumbing
- AI Plays Path of Exile Part 5: Real-Time Obstacle and Enemy Detection using CNNs in TensorFlow
Tags: Computer Science, Deep Learning, Gaming, Machine Learning, Path Of Exile, Python, Screenshot, Software, Windows Api
Analysis of Historical Weather Data for Los Angeles, CA
Fri, 04 Aug 2017
This post explores historical weather data from Los Angeles, California over the period of 1906 to the present using Pandas and Matplotlib. The data in the post was collected from the National Centers for Environmental Information website. An order must be placed through the website to obtain a (temporary) link to download the data.
Tags: Climate Change, Data Science, Data Visualization, Los Angeles, Weather
Path of Exile AI Teaser Footage
Mon, 31 Jul 2017
I compiled a short video of footage from the Path of Exile AI. All footage is of the actual AI running. The video is available below on my YouTube channel.
Stayed tuned for more posts about the Targeting System and Screen Viewer components in the next few weeks.
Tags: Computer Science, Deep Learning, Gaming, Machine Learning, Path Of Exile, Poe, Python, Software, Video
An Annotated Timeline of the Bitcoin to USD Exchange Rate
Fri, 28 Jul 2017
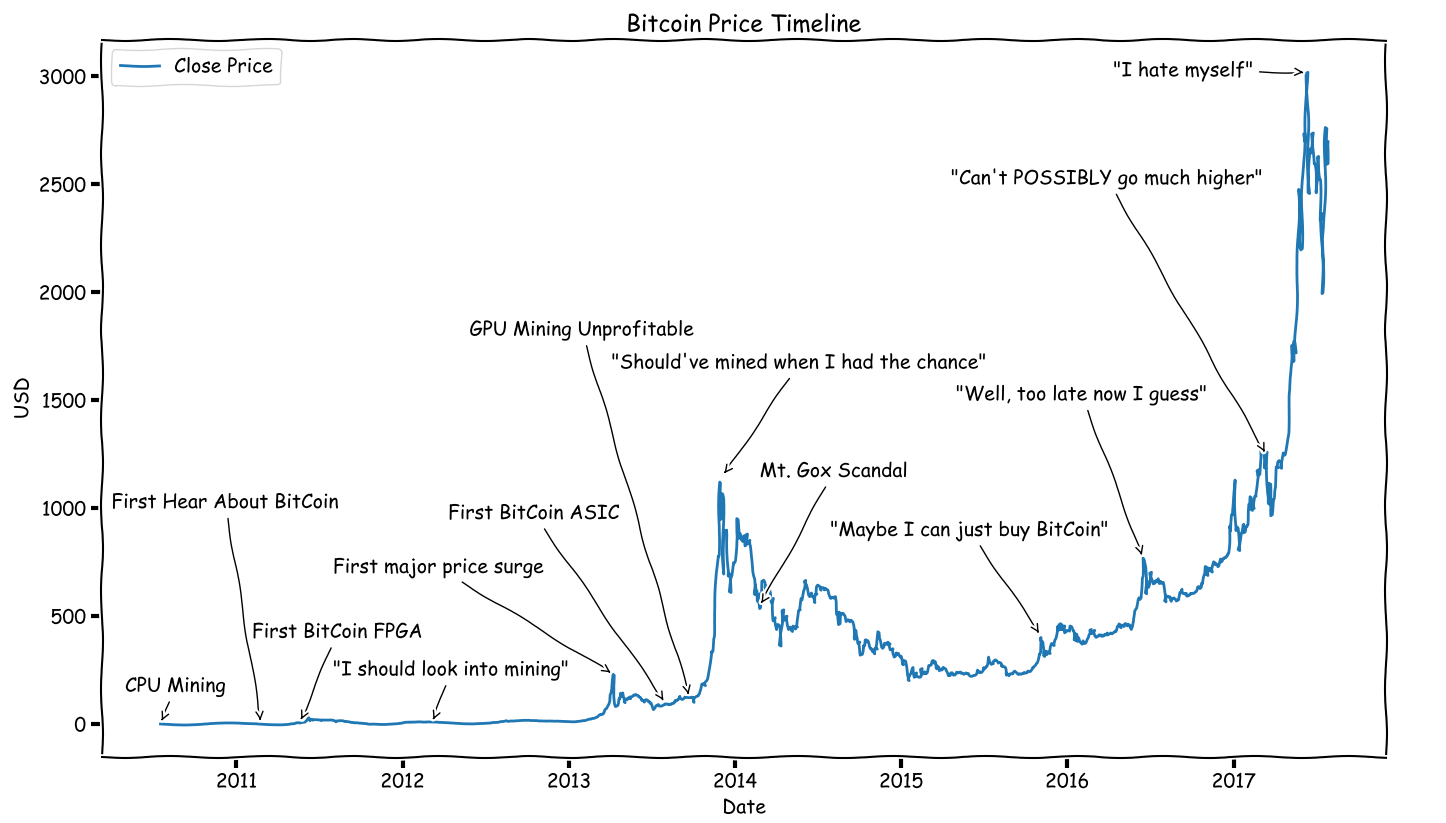
Tags: Bitcoin, Cryptocurrency, Image, Matplotlib
Introducing GopherJoy: A Controller Input Application
Fri, 21 Jul 2017
So, I was looking for a way to use my XBox 360 Controller for Windows to browse the web and play games without built-in controller support. After searching for a while, I found most existing applications were either not free or did not work very well. Some required extra dll files (pro-tip DON'T search for "[insert name].dll missing" and download the first thing you find), or were not fully functional. Having experience handling mouse and keyboard input using Windows API, I decided to see if I could come up with something better. The result: GopherJoy.
Tags: Gaming, Golang, Path Of Exile, Pc Controller, Software, Windows
PoE AI Part 3: Movement and Navigation
Wed, 19 Jul 2017
This post is part of a series on creating an AI for the game Path of Exile © (PoE). In this post, techniques for moving the character around a level are explored.
Tags: Bot, Computer Science, Gaming, Machine Learning, Path Of Exile, Poe, Python, Security, Software
Calibrating a Projection Matrix for Path of Exile
Sun, 09 Jul 2017
This post is part of a series on creating an AI for the game Path of Exile © (PoE). In this post, techniques for updating the internal representation of the world given a static image of the game are explored.
Tags: 3D Projection, Camera Transform, Computer Science, Gaming, Machine Learning, Poe, Python, Software, Tensorflow
A Deep Learning Based AI for Path of Exile: A Series
Sat, 08 Jul 2017
This post is the first in a series on creating an AI for the game Path of Exile based on deep learning and other machine learning techniques. A list of posts in this series follows.
- A Deep Learning Based AI for Path of Exile: A Series
- Calibrating a Projection Matrix for Path of Exile
- PoE AI Part 3: Movement and Navigation
- PoE AI Part 4: Real-Time Screen Capture and Plumbing
- AI Plays Path of Exile Part 5: Real-Time Obstacle and Enemy Detection using CNNs in TensorFlow
Tags: Bot, Computer Science, Deep Learning, Gaming, Machine Learning, Poe, Python, Software
Replacing the Fan of a NVidia GTX 970 Reference Edition
Sat, 06 May 2017
I recently acquired a NVidia GTX 970 Founder's Edition. The device had a damaged fan. As can be clearly seen in the photo, the fan did not sit properly in the mount. This caused the fan to scrape against its metal housing, preventing it from spinning. Actually it's not clear at all. Nevertheless, the side closest to the camera is higher than the other.
Tags: Computer Repair, Computers, Gpu, Hardware
Multi-Layer Perceptron Networks in Theano and TensorFlow: An Implementation and Benchmark
Sat, 15 Apr 2017
A past blog post explored using multi-layer-perceptrons (MLP) to predict stock prices using Tensorflow and Python. This post introduces another common library used for artificial neural networks (ANN) and other numerical purposes: Theano. An MLP Python class is created implemented using Theano, and then the performance of the class is compared with the TFANN class in a benchmark.
Tags: Ai, Ann, Benchmark, Computer Science, Machine Learning, Mlp, Python, Tensorflow, Theano
Image Classification Using Convolutional Neural Networks
Sun, 02 Apr 2017
This blog post introduces a type of neural network called a convolutional neural network (CNN) using Python and TensorFlow. A brief introduction to CNNs is given and a helper class for building CNNs in Python and TensorFlow is provided. The source code from this post is available here on GitHub.
Tags: Classification, Cnn, Computer Science, Computer Vision, Machine Learning, Neural Networks, Python, Tensorflow
Visualizing Neural Network Performance on High-Dimensional Data
Mon, 13 Mar 2017
This post presents a short script that plots neural network performance on high-dimensional binary data using MatPlotLib in Python. Binary vectors, or vectors only containing 0 and 1, can be useful for representing categorical data or discrete phenomena. The code in this post is available on GitHub.
Tags: Computer Science, Deep Learning, Machine Learning, Matplotlib, Neural Networks, Python, Software, Tensorflow
ShortX: A Hotkey Program for Windows
Tue, 21 Feb 2017
This post introduces a new program I wrote in Go and C named ShortX. ShortX allows for the creation of keyboard shortcuts that can be used to trigger other keys or commands. The program runs in the background and triggers shortcuts that are specified in a simple ini file.
Expansion is accomplished using low-level Windows API calls so that resource utilization is kept low. ShortX is useful for launching program in Windows, for custom macros in games, and more. Program executables are available on the Software page.
Tags: Golang, Hotkeys, Macros, Shortcuts, Software, Windows
WPA2 Key Derivation with Anaconda Python
Wed, 16 Nov 2016
This post is regarding the WPA2 4-way handshake that is used for authentication and the establishment of encryption keys for secure wireless communication. A practical implementation of the key derivation process is provided in python. The sample packet capture containing the 4-way handshake that is used in this post is available here. The complete source code discussed in this post is on Github. The software Wireshark is used to analyze the provided packet trace.
Tags: Anaconda, Computer Science, Cryptography, Networking, Python, Security, Wireless Networks, Wpa2
Text Mining Online Reviews for Sentiment Analysis
Fri, 28 Oct 2016
This post aims to introduce several basic text mining techniques. Sample implementations will be explored in the Scikit-learn library using Anaconda Python.
Tags: Data Science, Machine Learning
Multimodal Biometrics for Enhanced Mobile Device Security
Sun, 28 Aug 2016
This post is a reference to a contributed article that I helped to co-author which was recently published in Communications of the ACM, Vol. 59 No. 4, Pages 58-65. The article, which I worked on while in graduate school, describes the advantages of using multimodal biometrics to secure mobile devices such as cell phones and tablets. An implementation for the Android OS of such a multimodal biometric system is presented along with results and a conclusion. Please find the article at this link, if you wish to read more.
N
Tags: Biometrics
Multi-Layer Perceptrons as Smoother Functions
Wed, 20 Apr 2016
In this post, the multi-layer perceptron (MLP) is presented as a method for smoothing time series data. A class based on the TensorFlow library is presented. Finally, for the sake of a toy example, the class is applied to the problem of smoothing historical stock prices (*).
Tags: Ann, Computer Science, Machine Learning, Mlp, Numpy, Python, Stock, Tensorflow
CombinoChord: A Guitar Chord Generator App
Tue, 05 Apr 2016
This post is concerned with an approach to generating guitar chords fingerings given run-time parameters regarding the guitar configuration and player's hand. The approach is expected to run acceptably on an Android mobile device and should be responsive to user input and should assign conventional fingerings high heuristic scores. The core source code that is described in this post is available at the following git repository. The app is available for download on the Google play store.
Tags: Android, Computer Science, Guitar, Mathematics, Music
Multi-Layer Perceptrons and Back-Propagation; a Derivation and Implementation in Python
Sun, 27 Mar 2016
Artificial neural networks have regained popularity in machine learning circles with recent advances in deep learning. Deep learning techniques trace their origins back to the concept of back-propagation in multi-layer perceptron (MLP) networks, the topic of this post. The complete code from this post is available on GitHub.
Tags: Computer Science, Machine Learning, Mathematics, Neural Networks, Numpy
Eigenfaces versus Fisherfaces on the Faces94 Database with Scikit-Learn
Thu, 18 Feb 2016
In this post, two basic facial recognition techniques will be compared on the Faces94 database. Images from the Faces94 database are 180 by 200 pixels in resolution and were taken as the subjects were speaking to induce variations in the images. In order to train a classifier with the images, the raw pixel information is extracted, converted to grayscale, and flattened into vectors of dimension \(180 \times 200 = 36000\). For this experiment, 12 subjects will be used from the database with 20 files will be used per subject. Each subject is confined to a unique directory that contains only 20 image files.
Tags: Biometrics, Computer Science, Facial Recognition, Machine Learning, Mathematics
Wine Classification Using Linear Discriminant Analysis
Sat, 13 Feb 2016
In this post, a classifier is constructed which determines the cultivar to which a specific wine sample belongs. Each sample consists of a vector \(\textbf{v}\) of 13 attributes of the wine, that is \(\textbf{v} \in \mathbb{R}^{13}\). The attributes are as follows:
- Alcohol
- Malic acid
- Ash
- Alcalinity of ash
- Magnesium
- Total phenols
- Flavanoids
- Nonflavanoid phenols
- Proanthocyanins
- Color intensity
- Hue
- OD280/OD315 of diluted wines
- Proline
Tags: Computer Science, Machine Learning, Mathematics
Breast Cancer Malignancy Classification using PCA and Logistic Regression
Sun, 07 Feb 2016
In this post, a linear classifier is constructed that aids in classifying fine needle aspiration (FNA) cytology results. The classifier receives a vector consisting of aggregate measurements from FNA of a breast mass. Each vector contains aggregations, over multiple cell nuclei, of the following ten measurements:
Tags: Computer Science, Data Science, Machine Learning, Mathematics