On the Influence of Recessions on the S&P 500 Index
Sat, 21 Mar 2020
Data Science, Data Visualization, Economics, Statistics
The following plots explore the influence of two economic factors during recessions on the S&P 500 index: unemployment and gross domestic product (GDP). A linear model is constructed to predict the low of the S&P 500 index during a given recession using two transformed variables derived from the maximum unemployment and GDP differentials for that recession.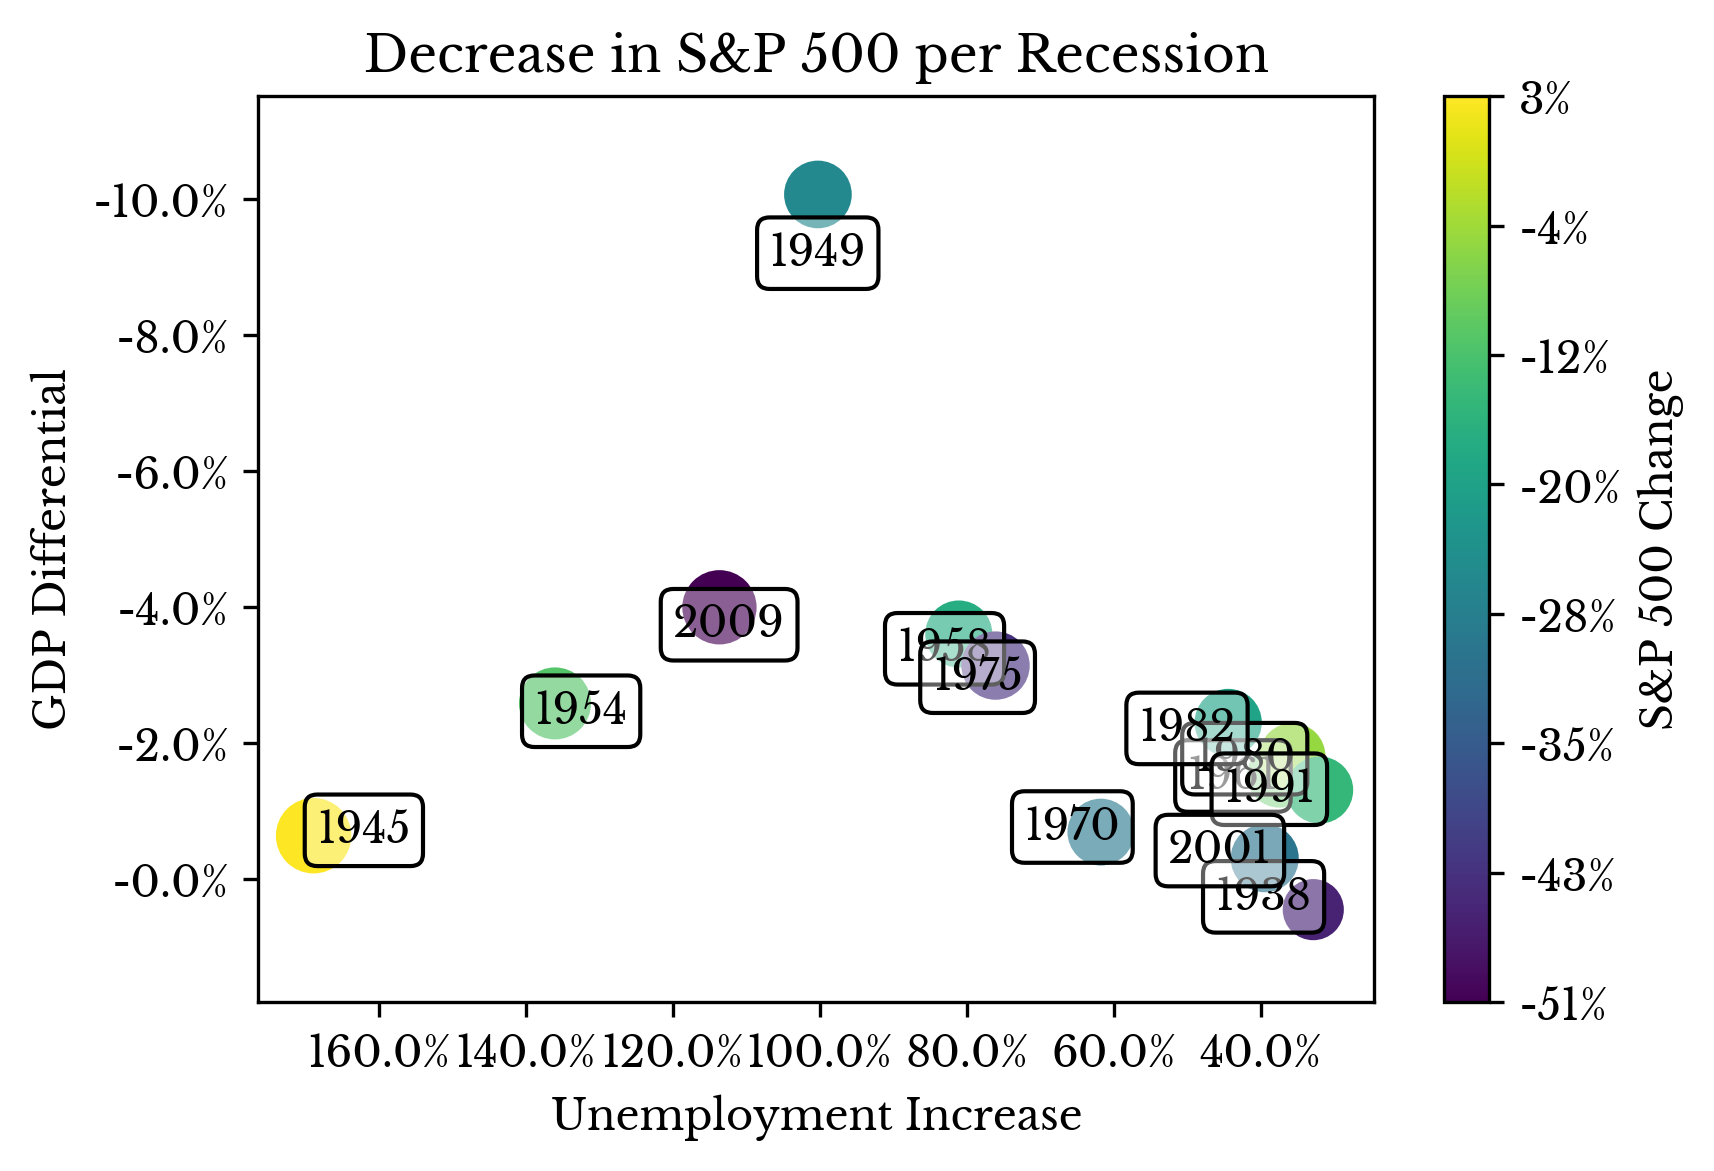 | 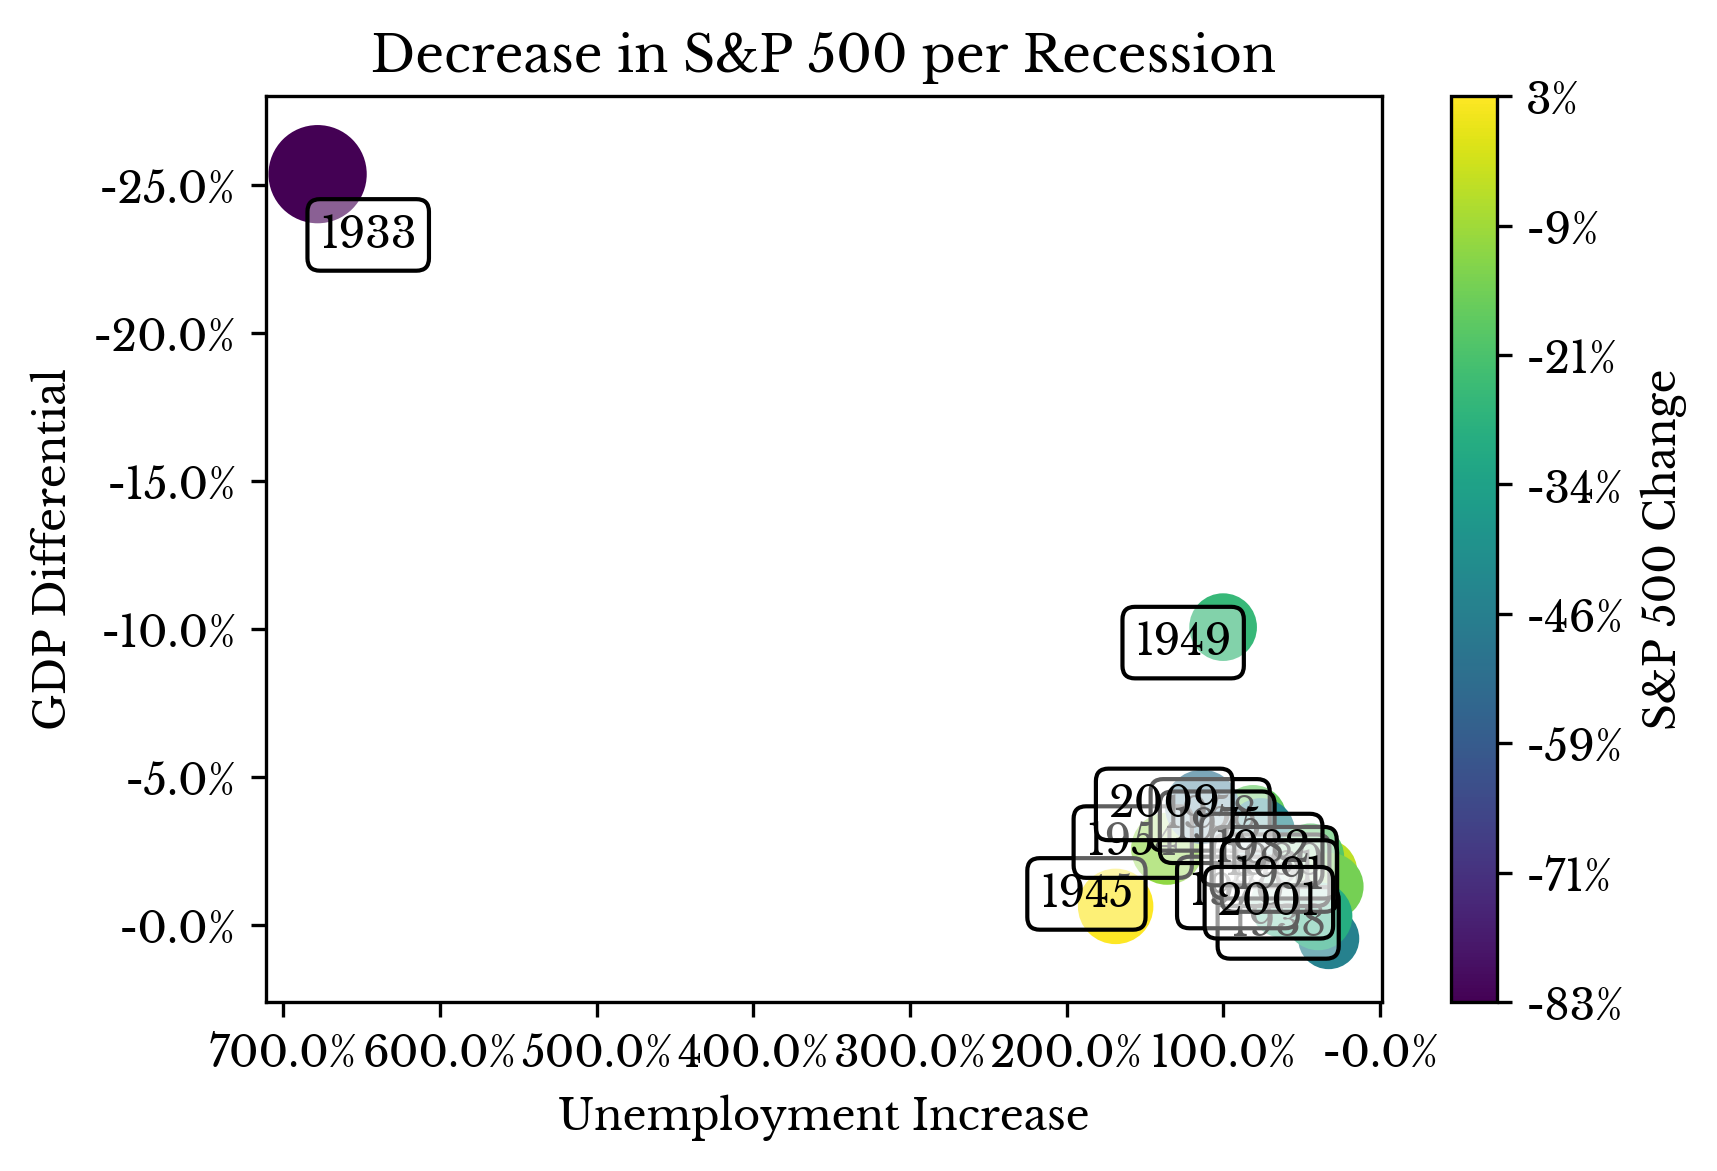 |
 |  |
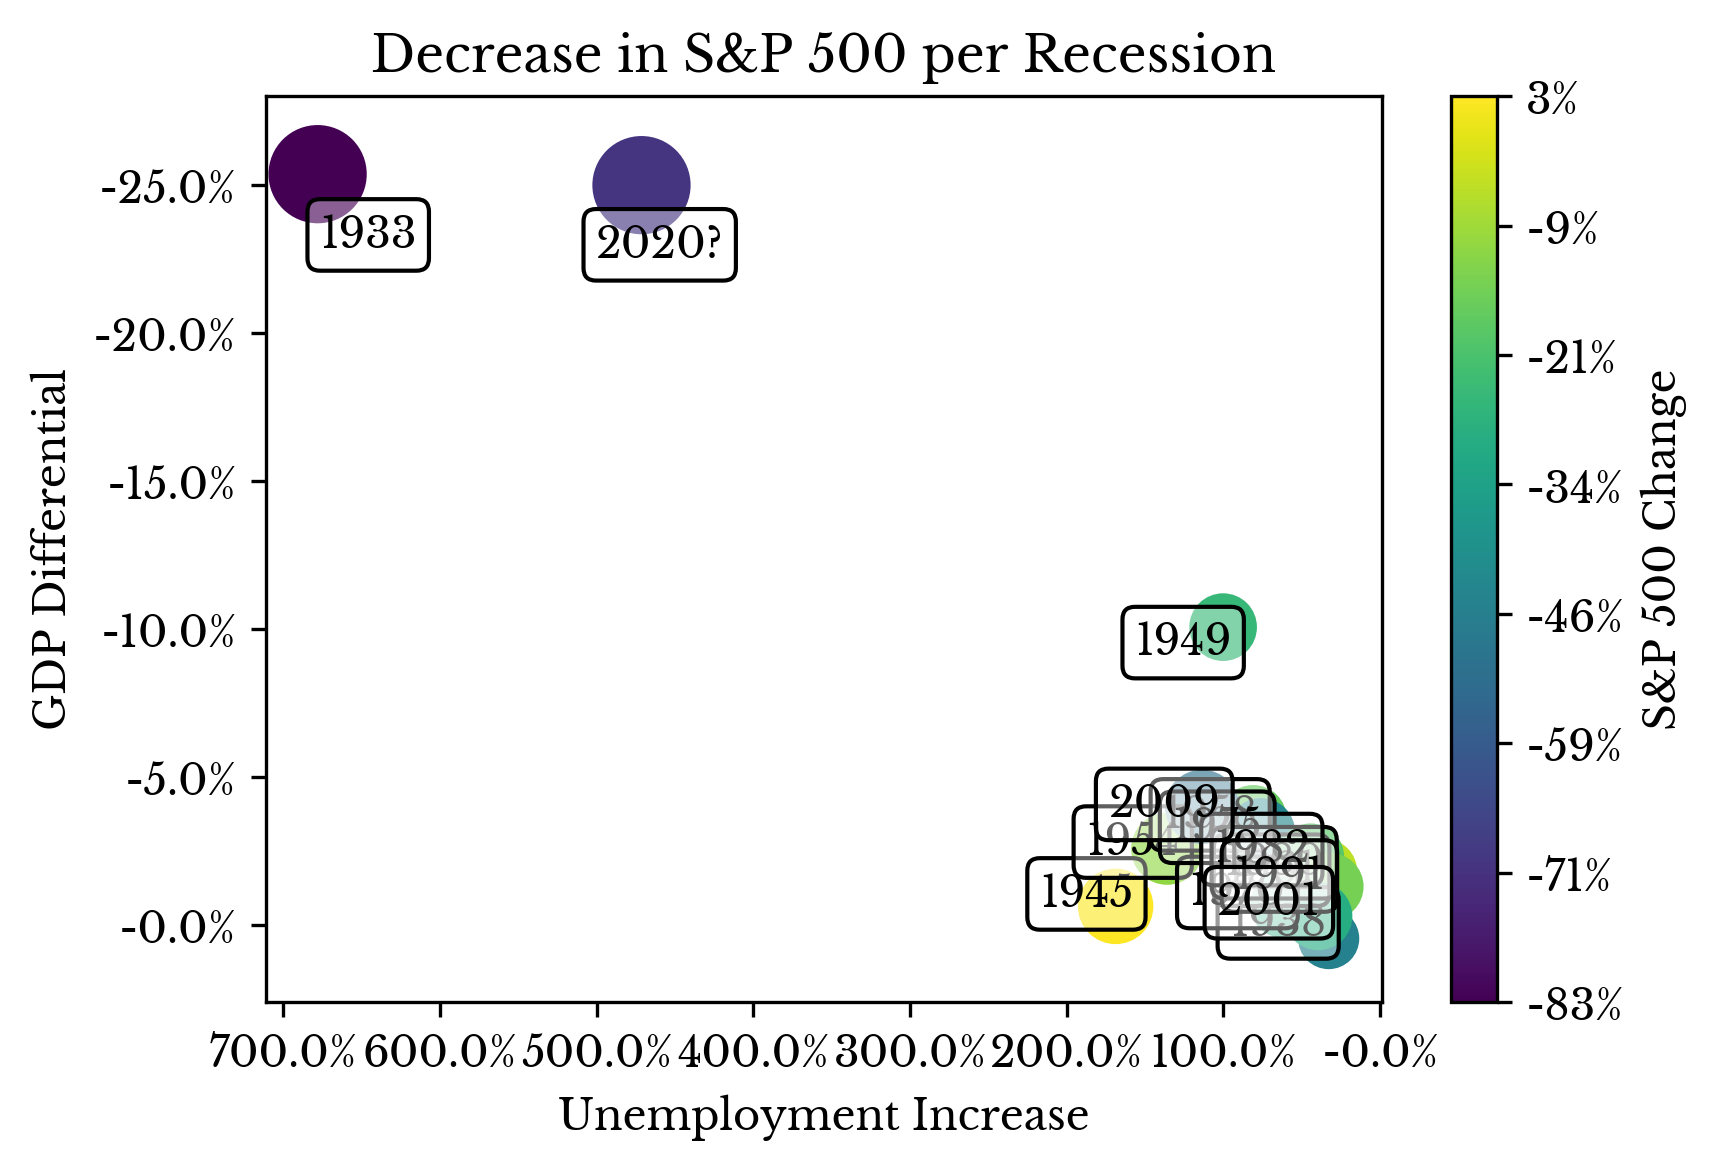 | |
Figure 1: Multiple Regression Analysis of Past Recessions
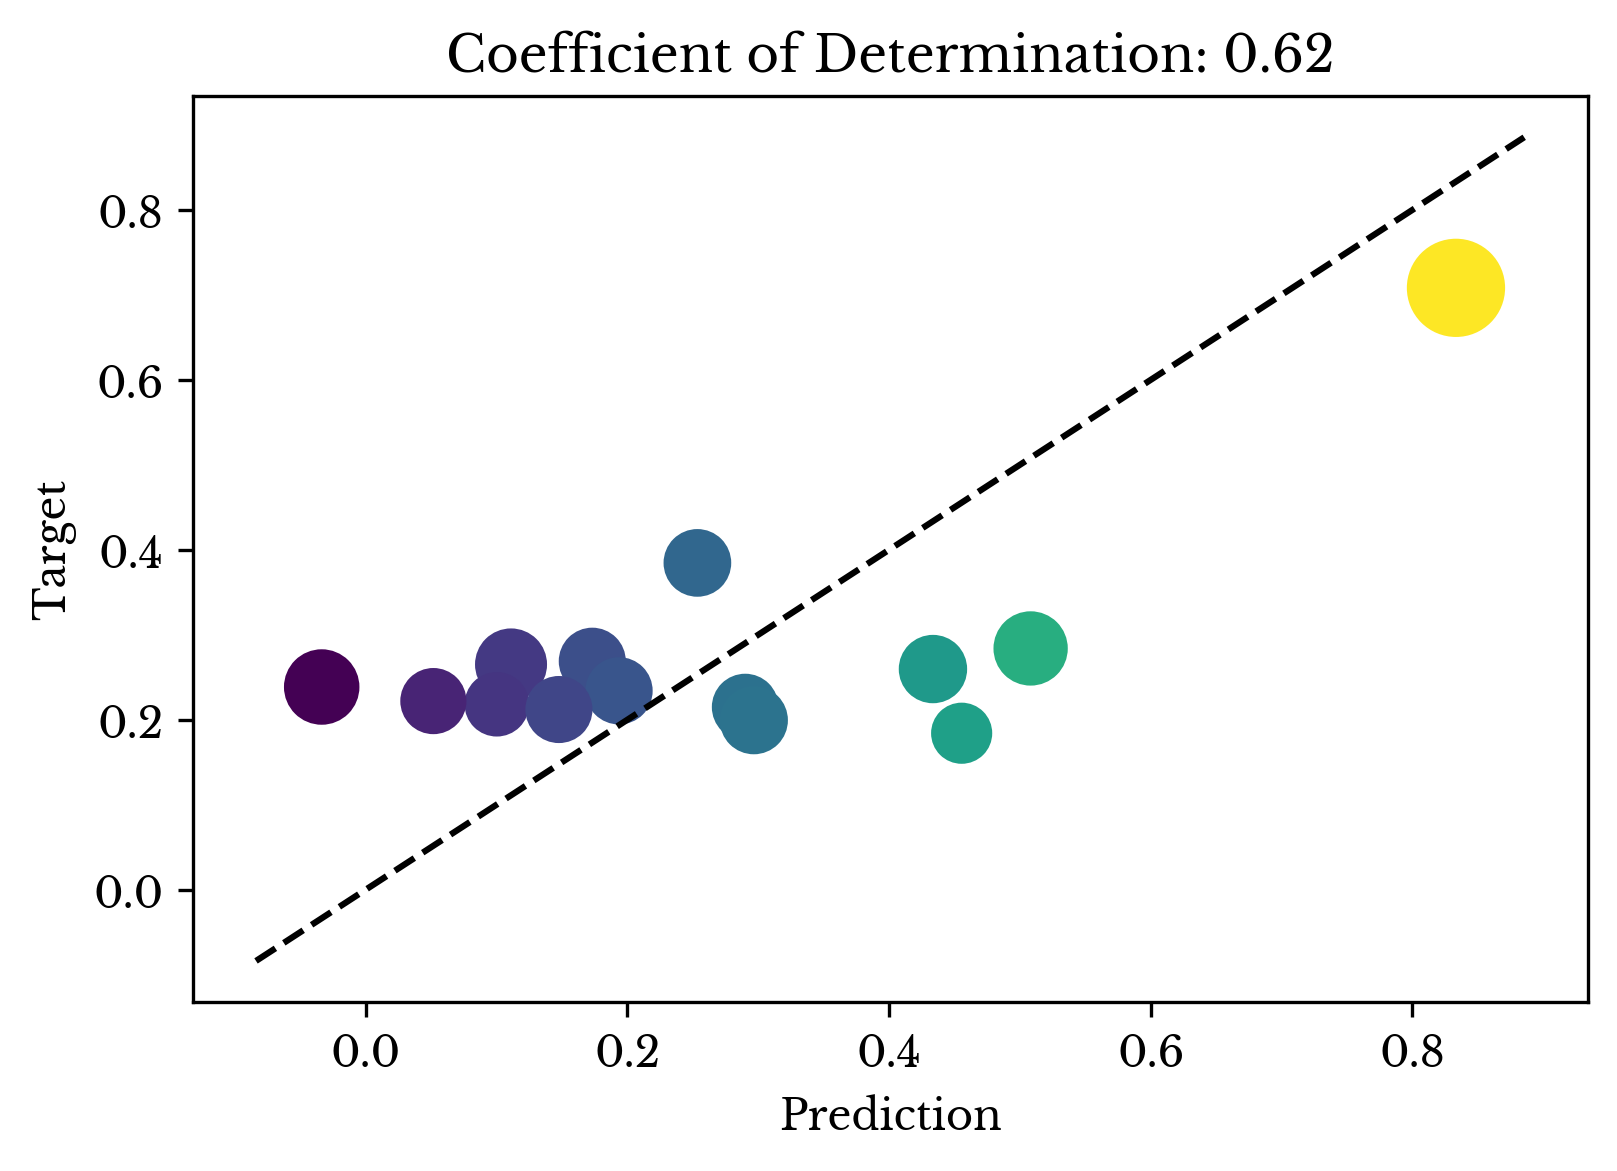
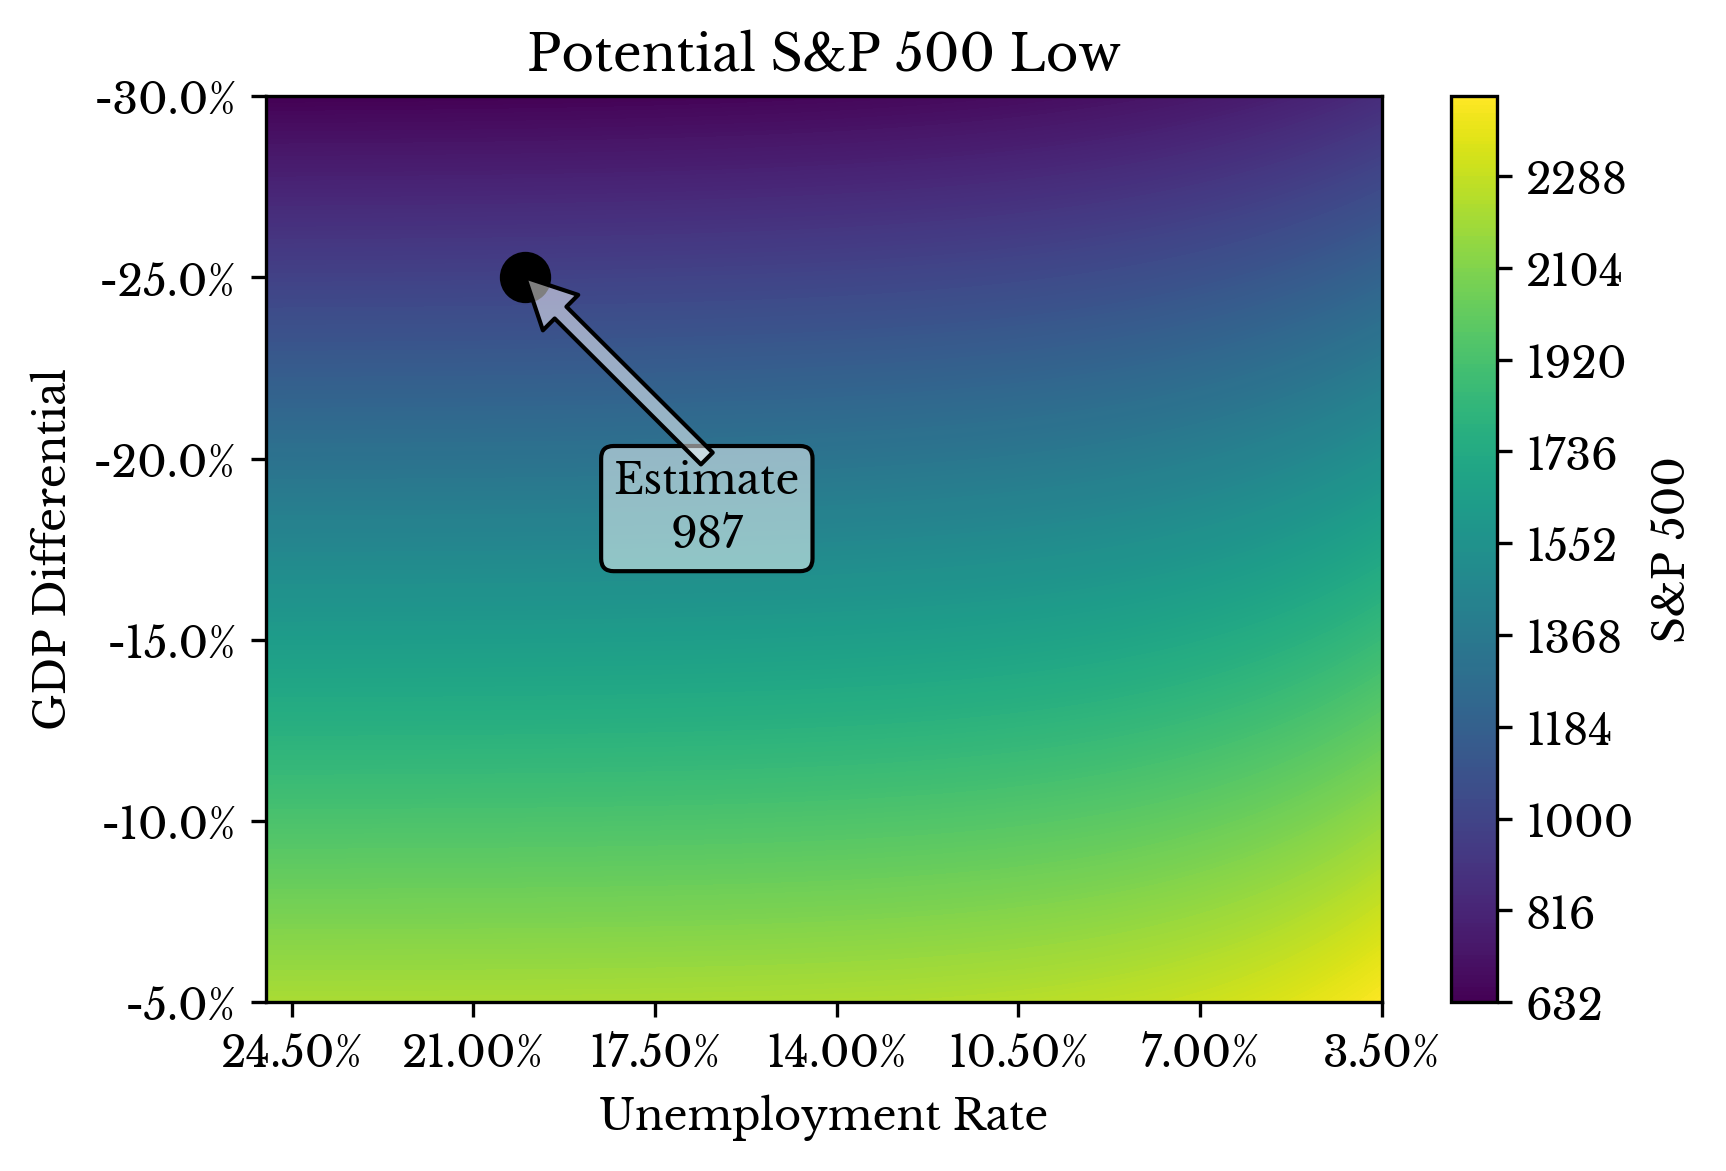
Predictions for the decrease in GDP and unemployment levels are taken to be 25% and 20% respectively. These are taken from Goldman Sachs predictions and estimates from Mnuchin respectively. A ridge regression model is fit with regularization weight chosen using grid search and leave one out validation.
Past recessions with more similarity both temporally and in terms of the current estimates are given more weight. By so doing, the model focuses on past recessions that are more similar in nature to the current situation. In the above plots, the weight of each recession is indicated by the size of the scatter plot marker.
Note: This post is for informational purposes only and does not constitute financial, professional, or any other form of advice.