US Housing Data Analysis - 2025
Mon, 26 May 2025
Data Analysis, Data Visualization, Housing, Housing-Market, Investing, Real-Estate, Realtor
Recently, some posts on social media were claiming that for-sale home listings in Washington DC were spiking, presumably due to recent cuts to government and other agencies. This post investigates data from Zillow Research, both to explore the US real estate market this year in general and to determine if such a claim holds any truth.If one compares the number of new listings in DC so far in 2025 to the average number of listings during the same week from 2023 and 2024, it does appear that there is some increase. However, plotting the same for the United States as a whole reveals a similar level of increase.
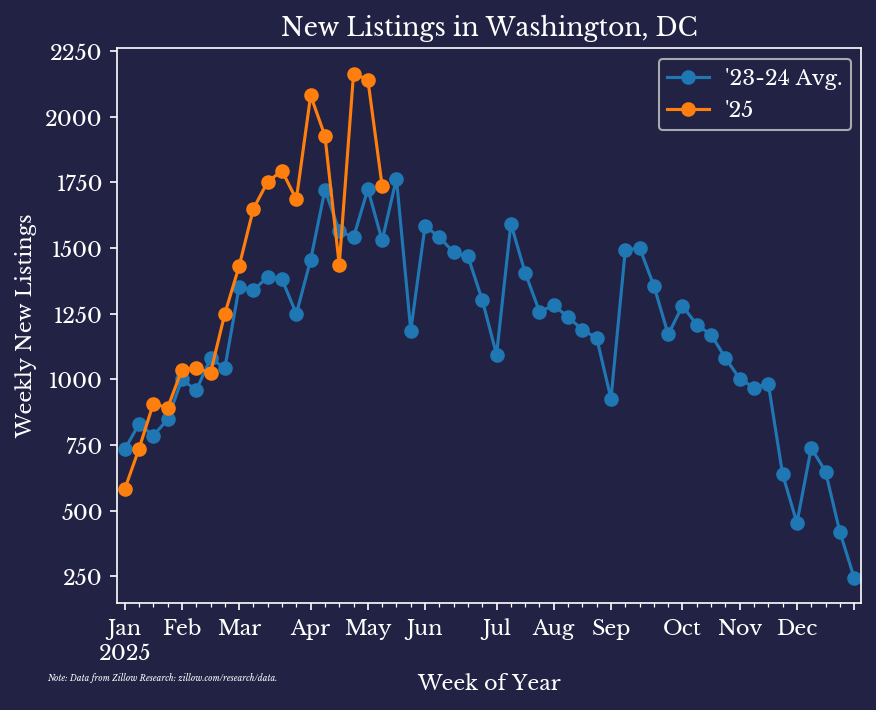 | 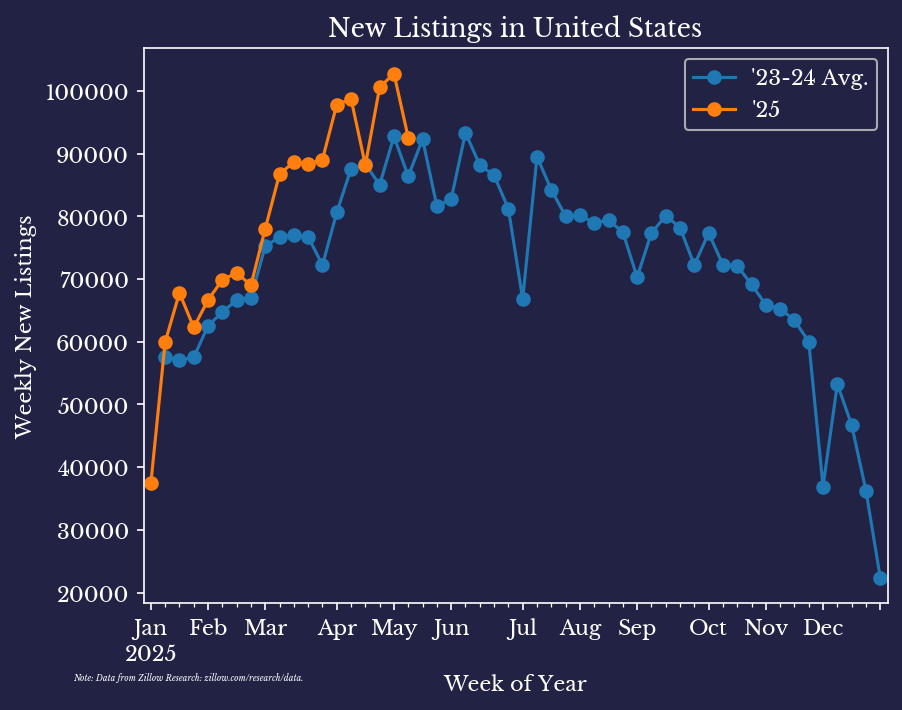 |
To better quantify this, one might look at the z-score for the percent change in current year over the 2023-24 baseline for Washington DC versus other regions. The following chart plots this weekly z-score for several large cities in the USA. Notably, DC does not seem to be particularly standout.
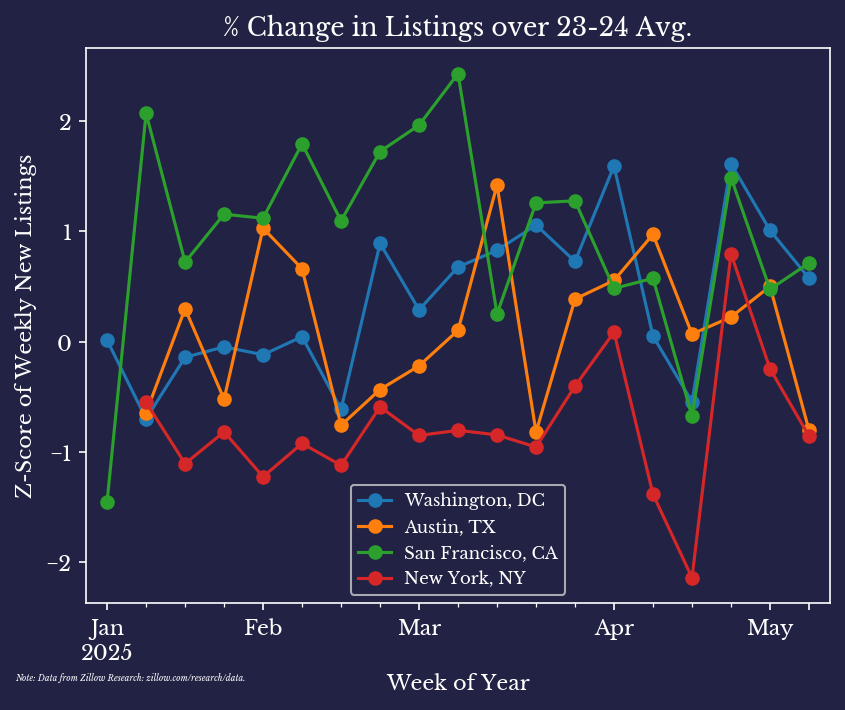
So which cities are standout, if any?
The next series of plots computes the average YTD z-score for all cities in the data and shows the top and bottom 10 cities and states. California, Washington, Idaho, Arizona, and Nevada have some of the highest average z-scores, though they are not particularly large, relatively speaking.
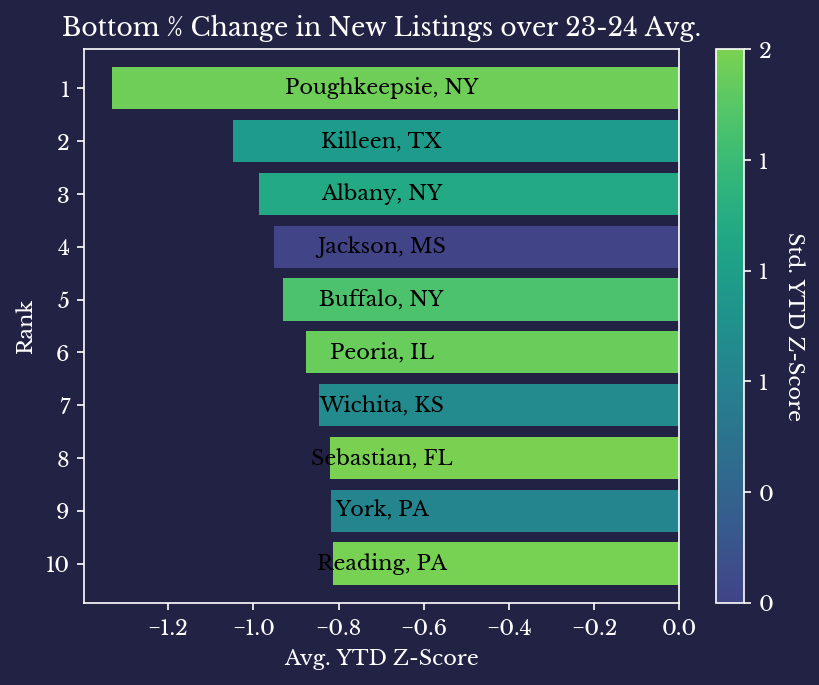 | 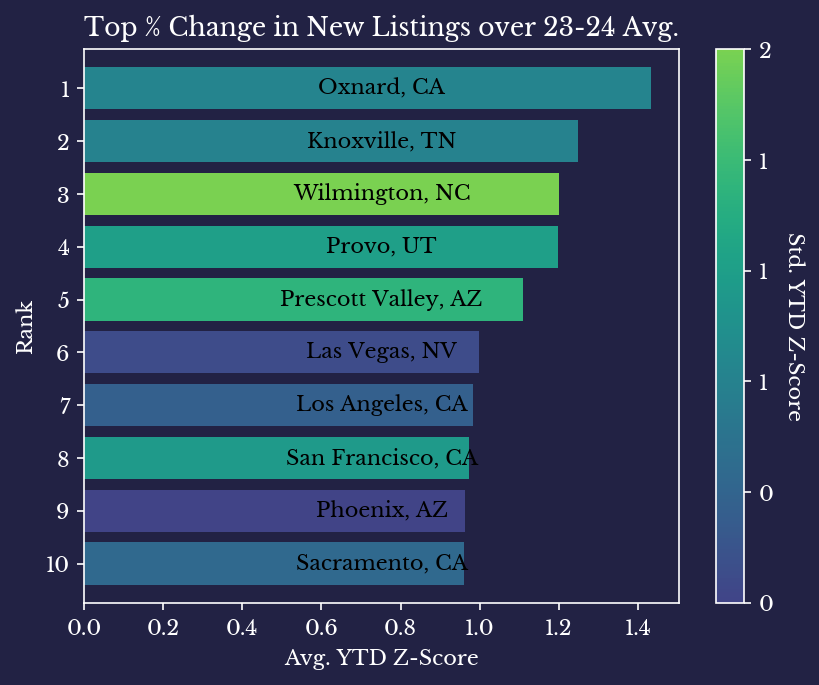 |
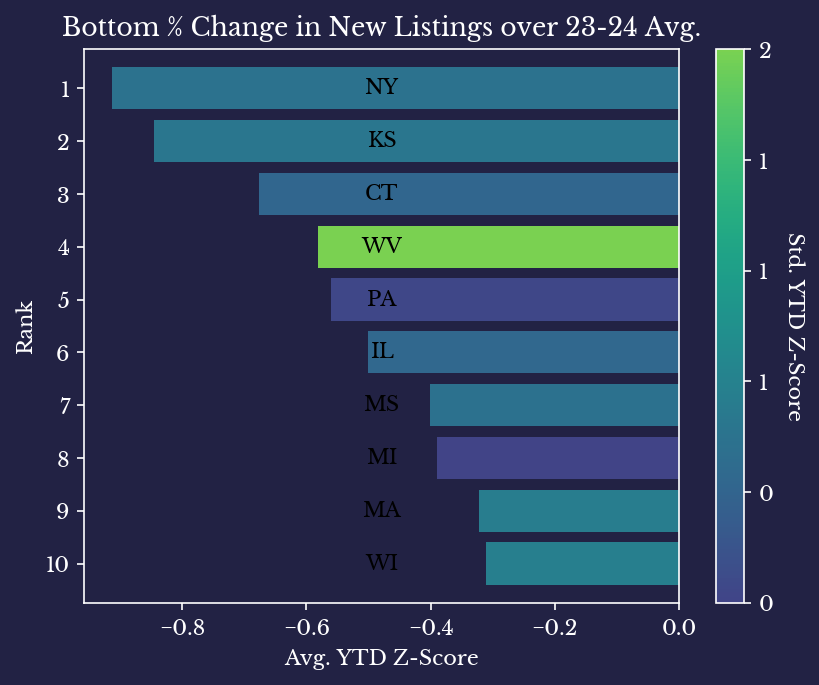 | 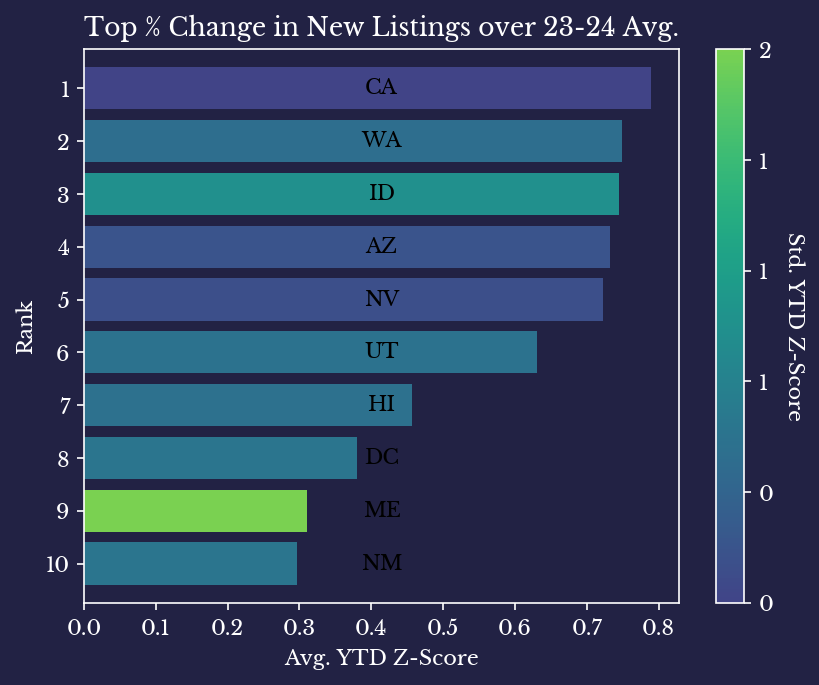 |
On the other hand, New York, Kansas, and Connecticut show some of the largest decreases in new listings over 2023-24, though they are not particularly large either.
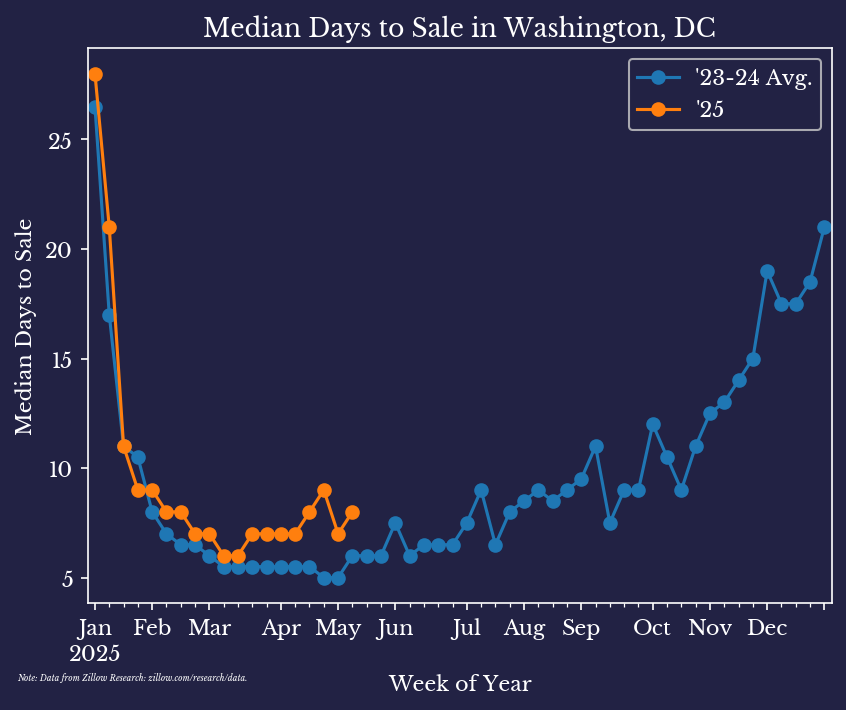
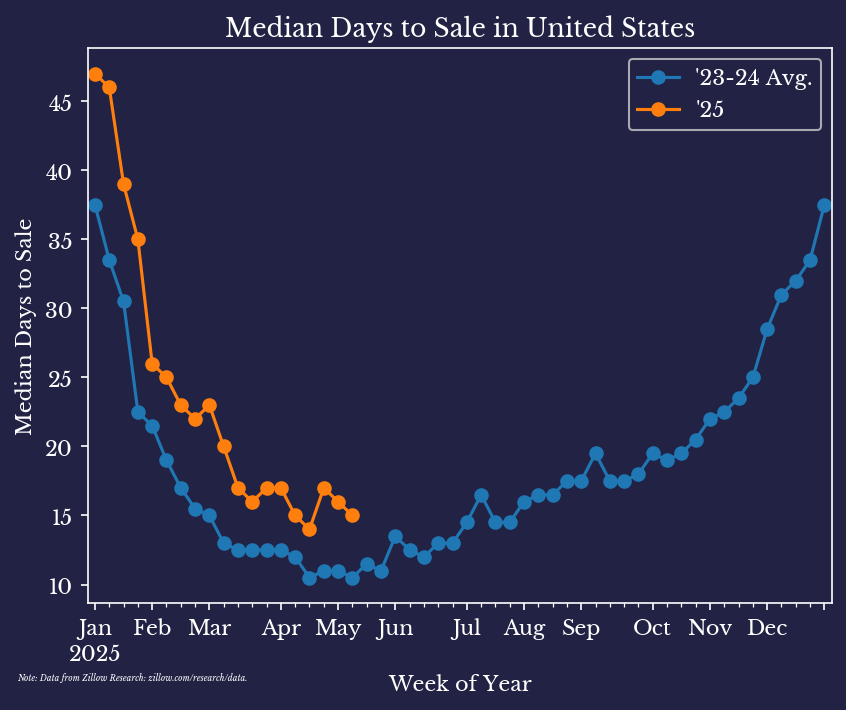
What about how long it takes to sell houses?
Again, Washington DC shows increased median days to sale (*) in 2025, but so does the overall USA.
 |  |
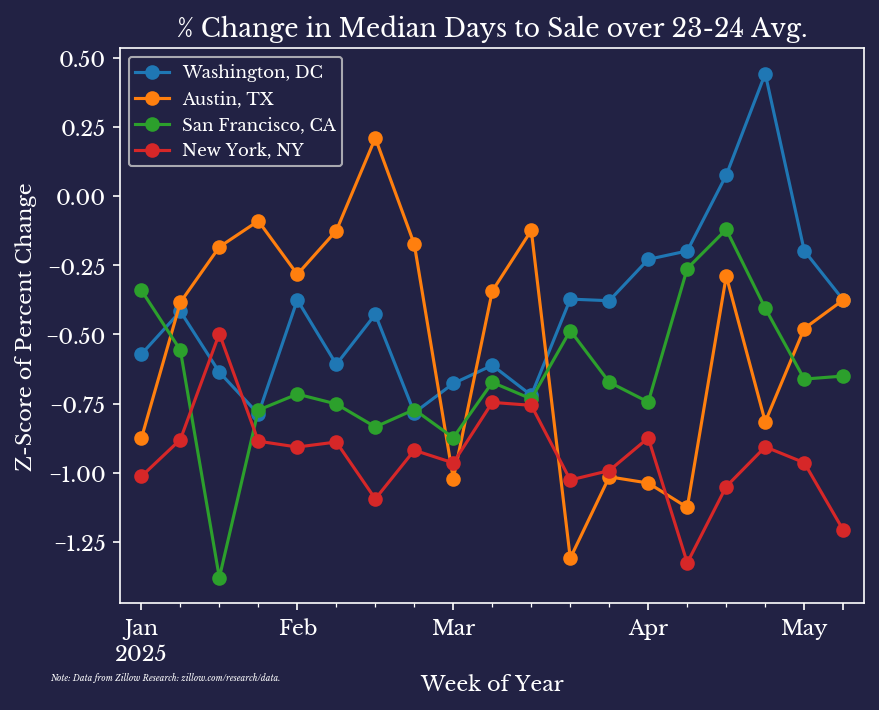
The following chart shows the percent change in median days to sale over 2023-2024 baseline. It reveals that DC is not particularly standout relative to three other large US cities.
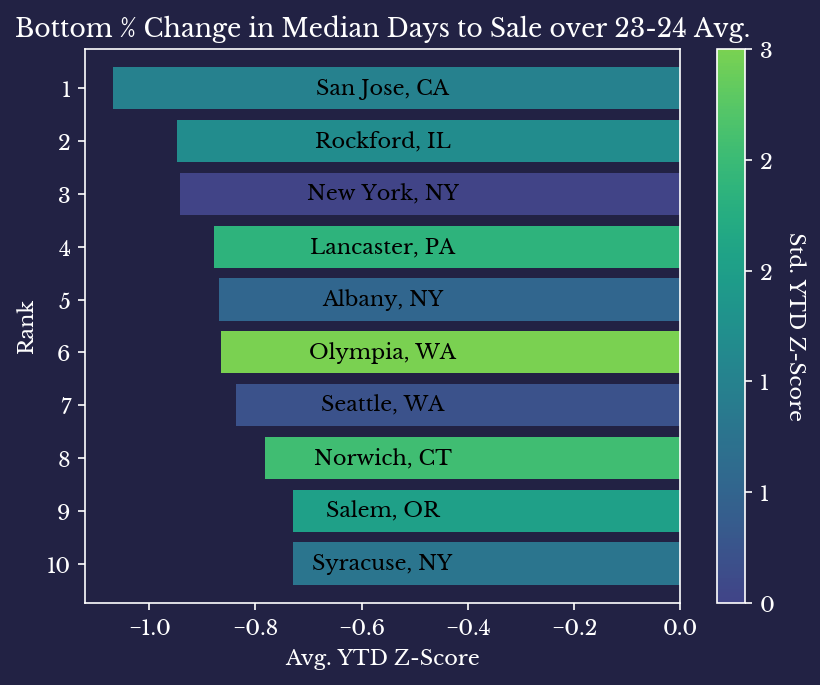
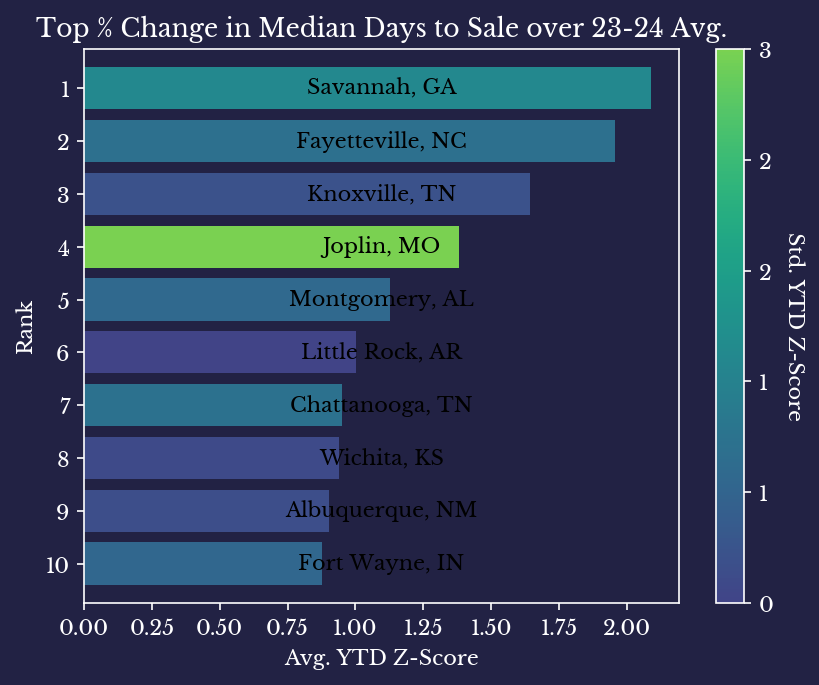
Which US cities and states are seeing the largest increases and decreases in median days to sale? The next few charts explore this in more detail.
 |  |
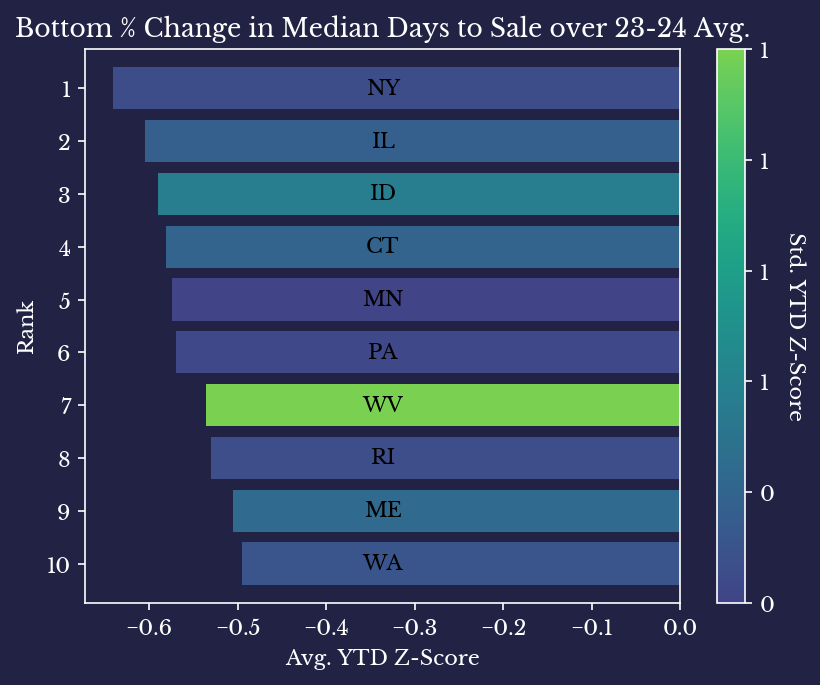 | 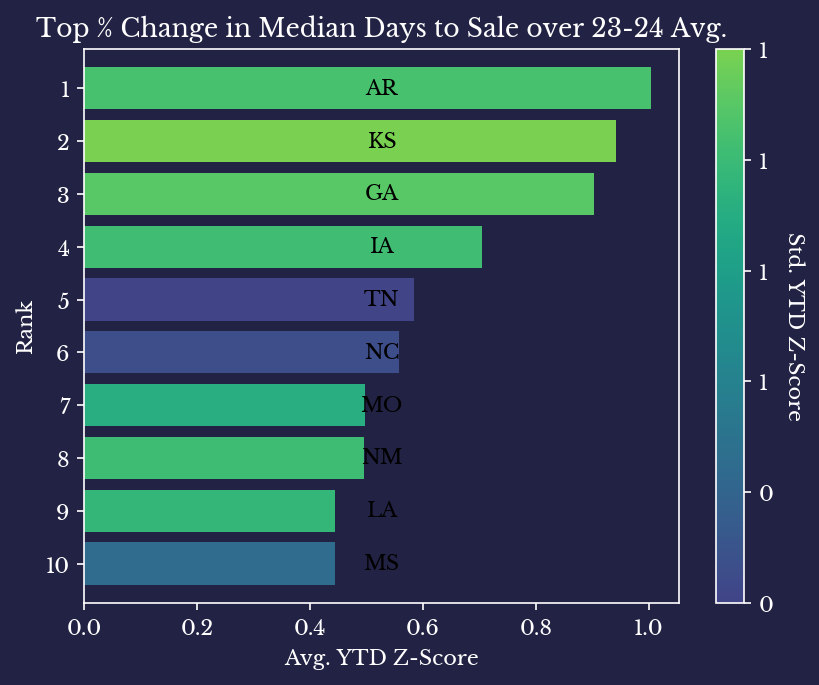 |
It seems that tech hubs like San Jose, New York, and Seattle are seeing inventory moving faster this year than in the previous two years. On the other hand, states like Arkansas, Kansas, Georgia, and Iowa are seeing a further slowdown recently. However, the change in most of these numbers is also not particularly large.
Zillow Research publishes a market temperature which attempts to quantify the balance between supply and demand in a given region. Per the website, "a higher number means the market is more tilted in favor of sellers." Per their methodology, temperature values above 55 indicate a seller's market while temperature values below 44 indicate a buyer's market.
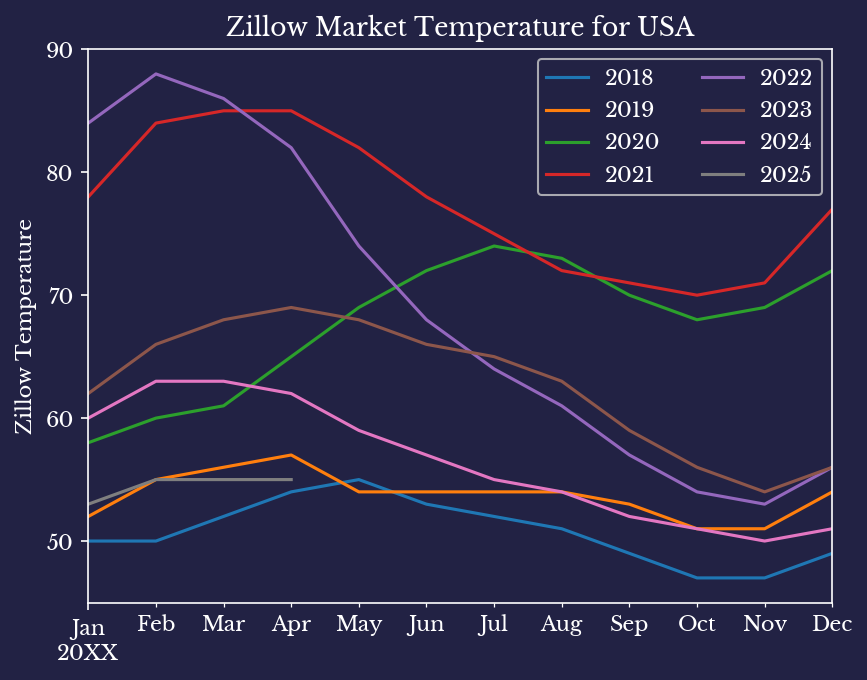 | 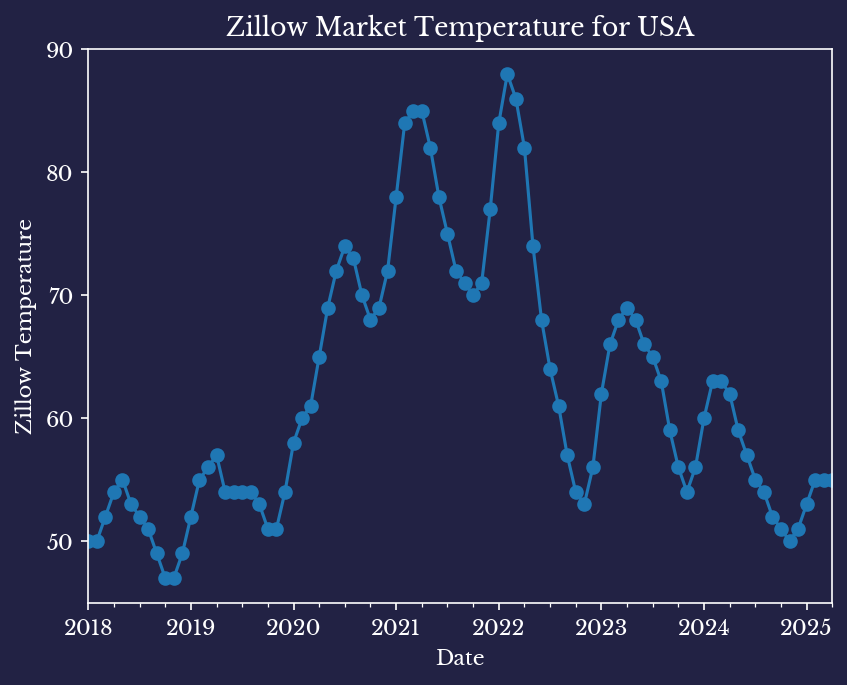 |
As a whole, the US market temperature has been trending lower over the past 3 years and this year looks to be continuing the trend downwards. However, the current US market temperature of 55 still indicates that the country, as a whole, falls into seller's market territory. Needless to say though, different stories are playing out in various markets throughout the country.
So, what are the hottest real estate markets in the USA right now?
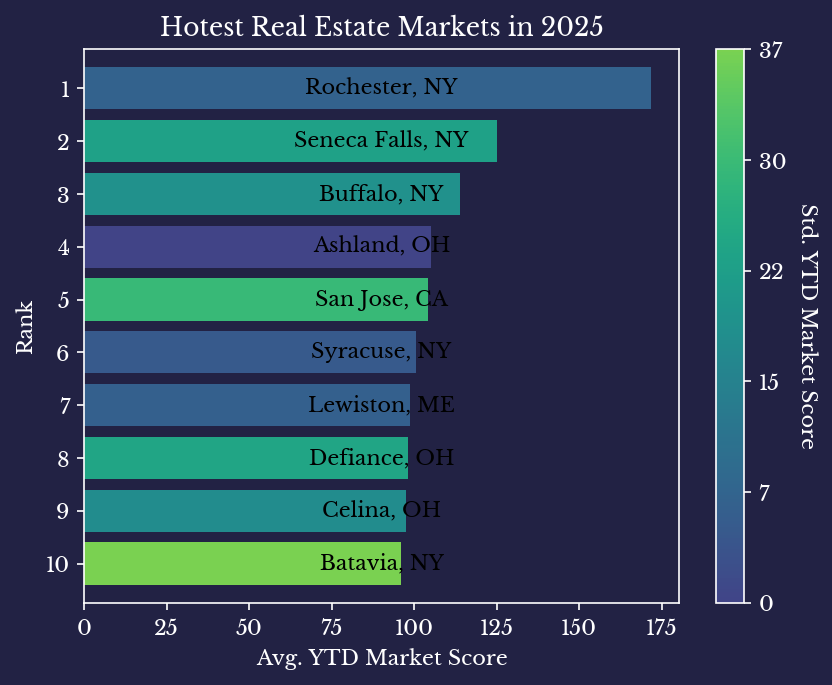 | 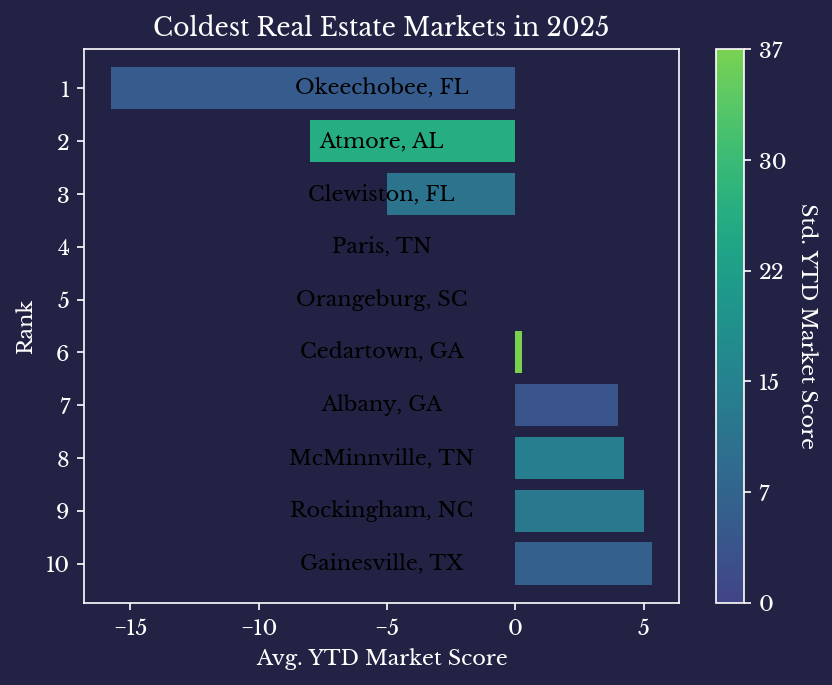 |
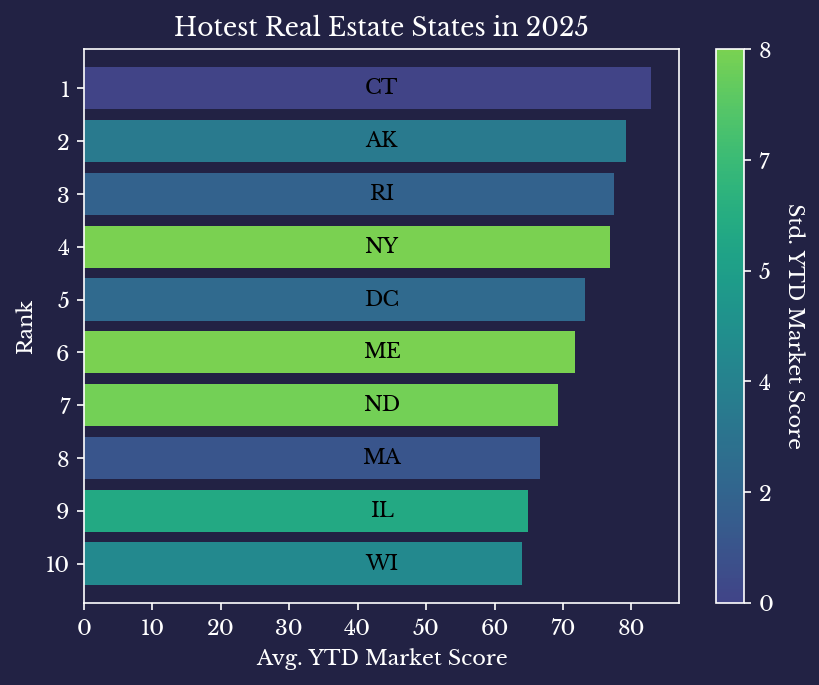 | 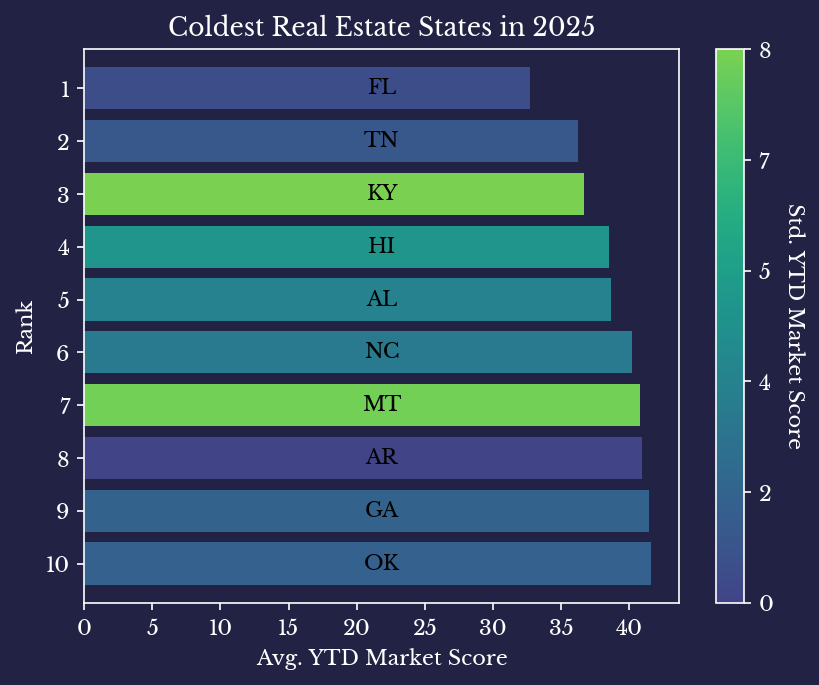 |
San Jose and several cities in New York are some of the hottest markets this year so far, with Zillow temperatures all indicative of strong seller's markets (temperature ≥70). On the other hand, Florida finds itself as one of the coolest, with the state average falling solidly in buyer's market territory. DC compares relatively favorably among states, but this is likely skewed by the fact that states have both rural and urban areas, while DC does not.
Overall, it seems there is a relative increase in both new listings and time on the market in 2025 so far. However, changes over the 2023-2024 baseline remain modest, which is unsurprising as the cost of borrowing has not shifted dramatically during this period. Finally, it does not appear that DC is particularly stand out this year.
Note: The data technically records the number of days till a home is marked as pending sale, which counts pending deals that fall through (*).