Increases in Circulatory Death During the Coronavirus Pandemic
Tue, 20 Dec 2022
Data Analysis, Data Visualization, Medicine
This post takes a closer look at Multiple Cause-of-Death records during the first year of the Coronavirus Pandemic. In this post, changes in mortality records involving the circulatory system (i.e. ICD-10 codes starting with I) are analyzed in more detail. These codes cover commonly occurring diseases like heart attacks, strokes, and other disease of the cardiovascular and, more broadly, the circulatory system.It is important to note that, over the past 20 years, the yearly count of deaths from circulatory causes decreases from around 2000 to 2010, before increasing again into recent history. Figure 1 shows the count of records with an underlying cause of death (UCOD) falling under all ICD-10 codes starting with I.

Figure 1: Circulatory Deaths by Year
As circulatory deaths have generally been in decline, in percentage terms, over the entire period, the valley-like shape is likely due to changes in underlying population demographics. For instance, the baby-boomer generation approaches the U.S. median life expectancy during this period, which could explain some of the increase. Regardless, it is important to account for this change when examining the potential impact of the Coronavirus Pandemic.In 2020, the year-over-year (YoY) change in circulatory deaths starts 2020 relatively normal, but sharply increases in the spring and summer months. Z-scores of the YoY changes are computed for 2015-2020 using the averages and standard deviations of the 2010-2019 numbers.
 |  |
Figure 2: Increases in Circulatory Deaths in 2020
From Figure 1, it is apparent that circulatory deaths significantly increase in both the spring and fall of the 2020. This is consistent with the understanding that Covid-19 infection significantly increases the risk of cardiovascular disease [1]. An interesting point is that the spike of over 7500 excess deaths in the spring of 2020 surpasses that of later increases despite the official case counts being lower over that period. This discrepancy may be due to the relative reduced availability of testing and/or increased virulence of the earlier strains active during the period. |  |
Figure 3: Increases in Circulatory Deaths Under 50 in 2020
Figure 3 shows similar plots for only those under the age of 50. As can be seen, similarly aberrant increases occur in the younger group. However, the second plot shows that the actual count of records is smaller, reflecting both the reduced size of the age group and reduced occurrence in the younger population. In summary, there is a significant increase in circulatory deaths in those under 50, though in overall terms in is still a small portion of the overall age group.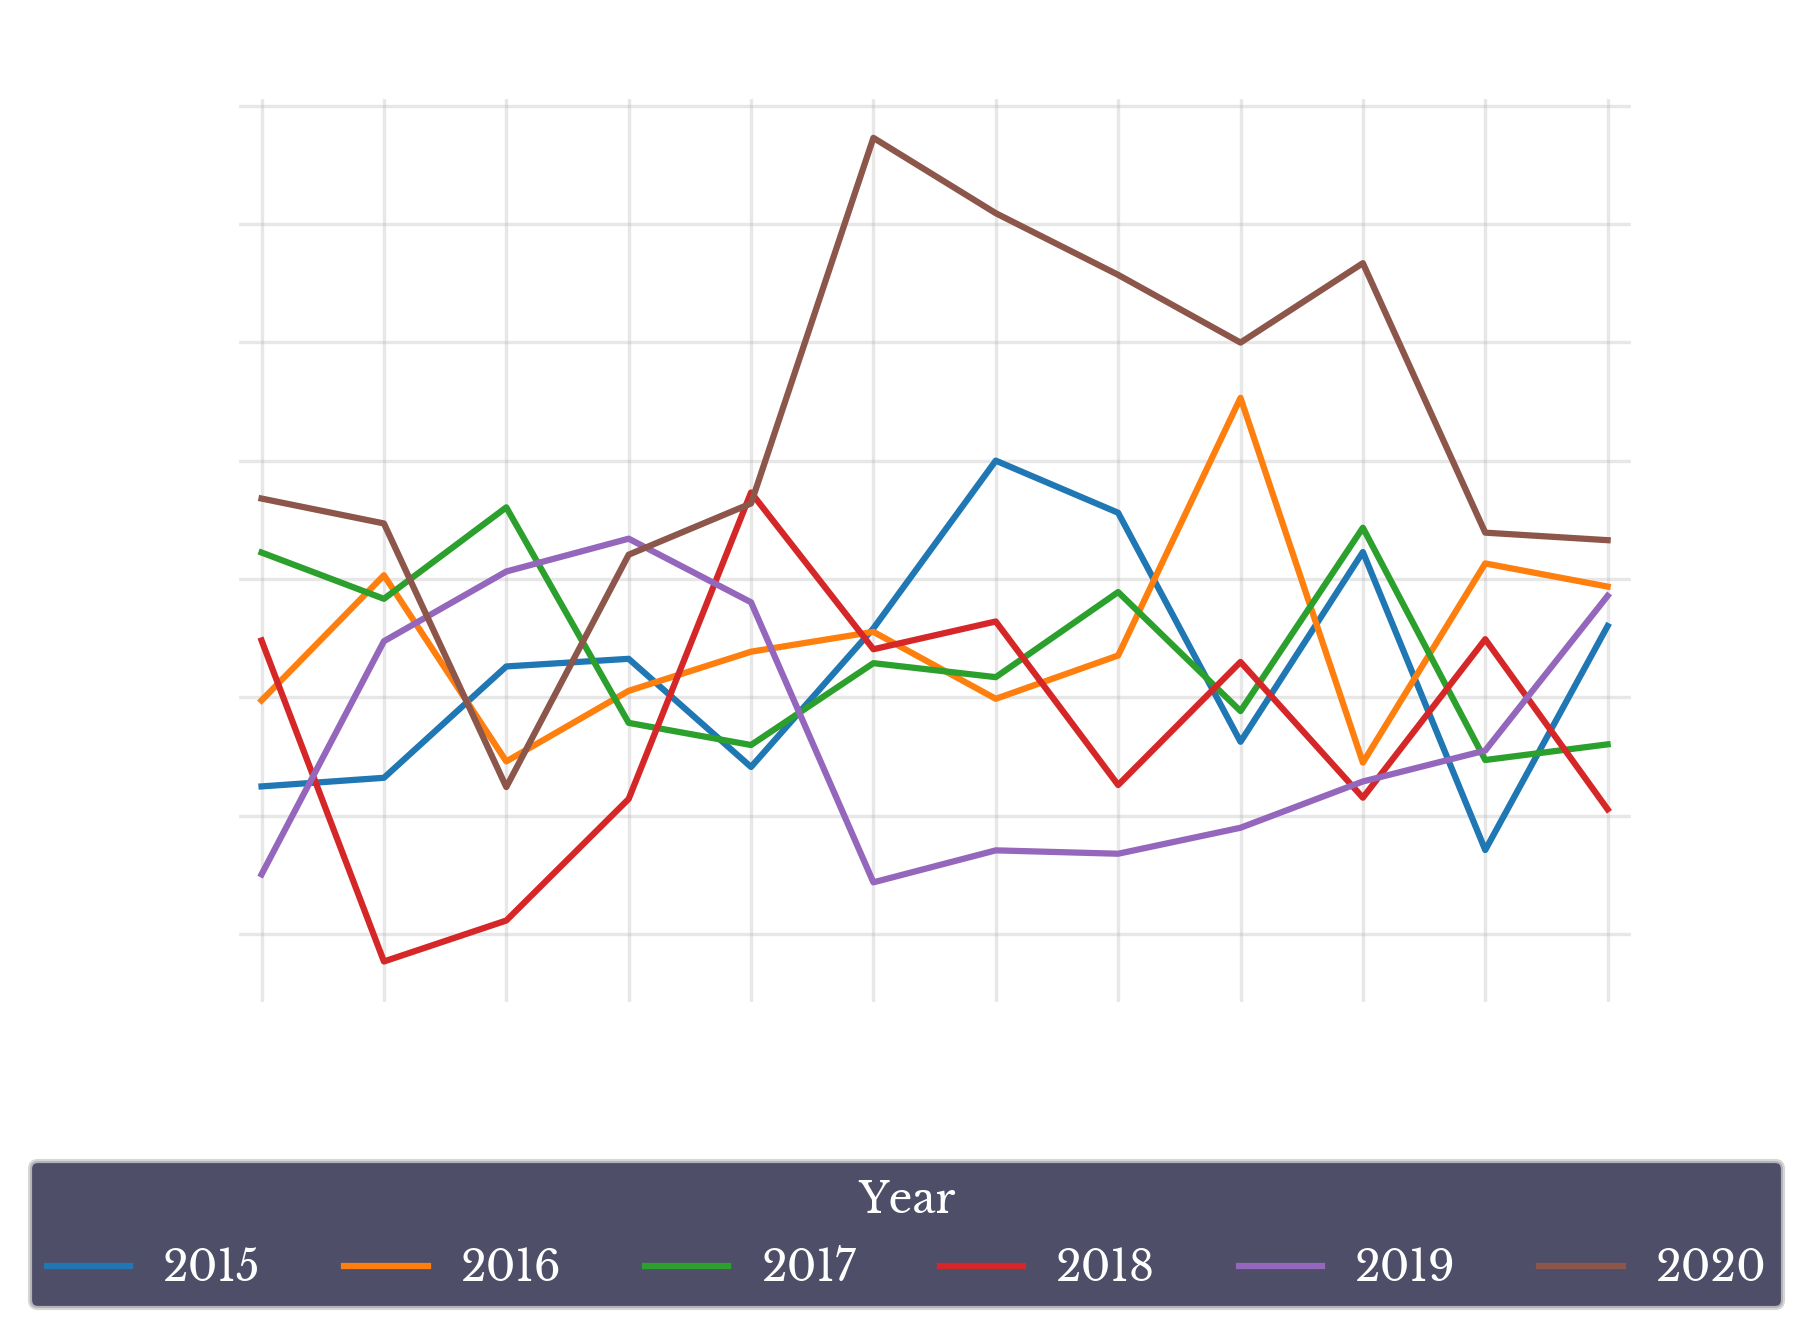 |  |
Figure 4: Increases in Circulatory Deaths Under 40 by Sex
Figure 4 further limits the population to those under age 40 and computes z-scores for men and women separately. In the younger age group, the increase appears to be greatest in males, with a significant increase occurring and largely persisting throughout the second-half of the year.An increase also occurs in females, but the actual changes are more in line with the broader 2010-2019 trend, apart from two spikes coinciding with the first two major case surges in 2020. This is reflected in the more moderate z-scores in Figure 4. Recall from Figure 1, that circulatory deaths are on an increasing trend over the past decade.
Figure 5 shows the raw counts of excess deaths in those under the age of 40 broken down by sex. As can be seen, the increase in males is roughly 2-3 times the increase in females during the second half of the year.

Figure 5: Increases in Circulatory Deaths Under 40 in 2020
In general, evidence suggests that men tend to be impacted by heart disease earlier than women on average and this data from the first year of the Covid-19 pandemic appears to corroborate this.Again, the actual counts in Figure 5 show the relatively lower rate of occurrence in the younger population. There appears to be a significant increase in young men, but in percentage terms it remains a small portion of the overall age group.
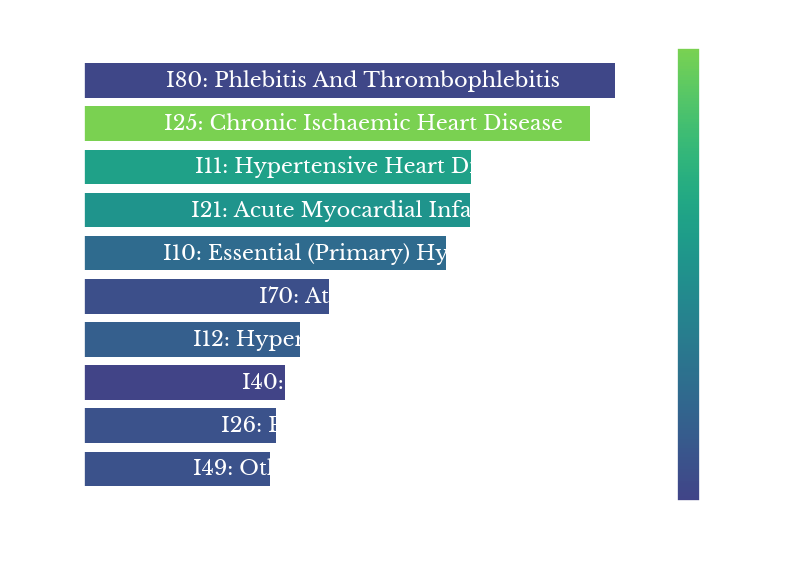 |  |
Figure 6: Breakdown Circulatory Death Increase by ICD-10 Code
Finally, Figure 6 shows the ICD-10 codes witnessing the most significant increases from 2019 to 2020. Z-scores are again computed using the 2010-2019 data and the color of each bar indicates the standard deviation of the yearly changes over this period. Bar charts are made for both the entire population and for those under 50. There are many commonalities between the two graphs, though the magnitude of increase for some conditions like pulmonary embolism is larger in the sub-50 group.In conclusion, a significant increase in deaths attributable to circulatory causes is observed in 2020. This increase appears to far exceed any ongoing population-level trends. These excess deaths primarily occur in older age groups, but significant increases are also observed in younger age groups. Finally, in younger age groups, larger increases are observed in males, though the overall excess in both sexes remains small in percentage terms.
[1] https://www.nature.com/articles/d41586-022-00403-0