Precipitation Totals by City in the USA
Fri, 19 Jun 2020
Data Visualization, Statistics, Weather
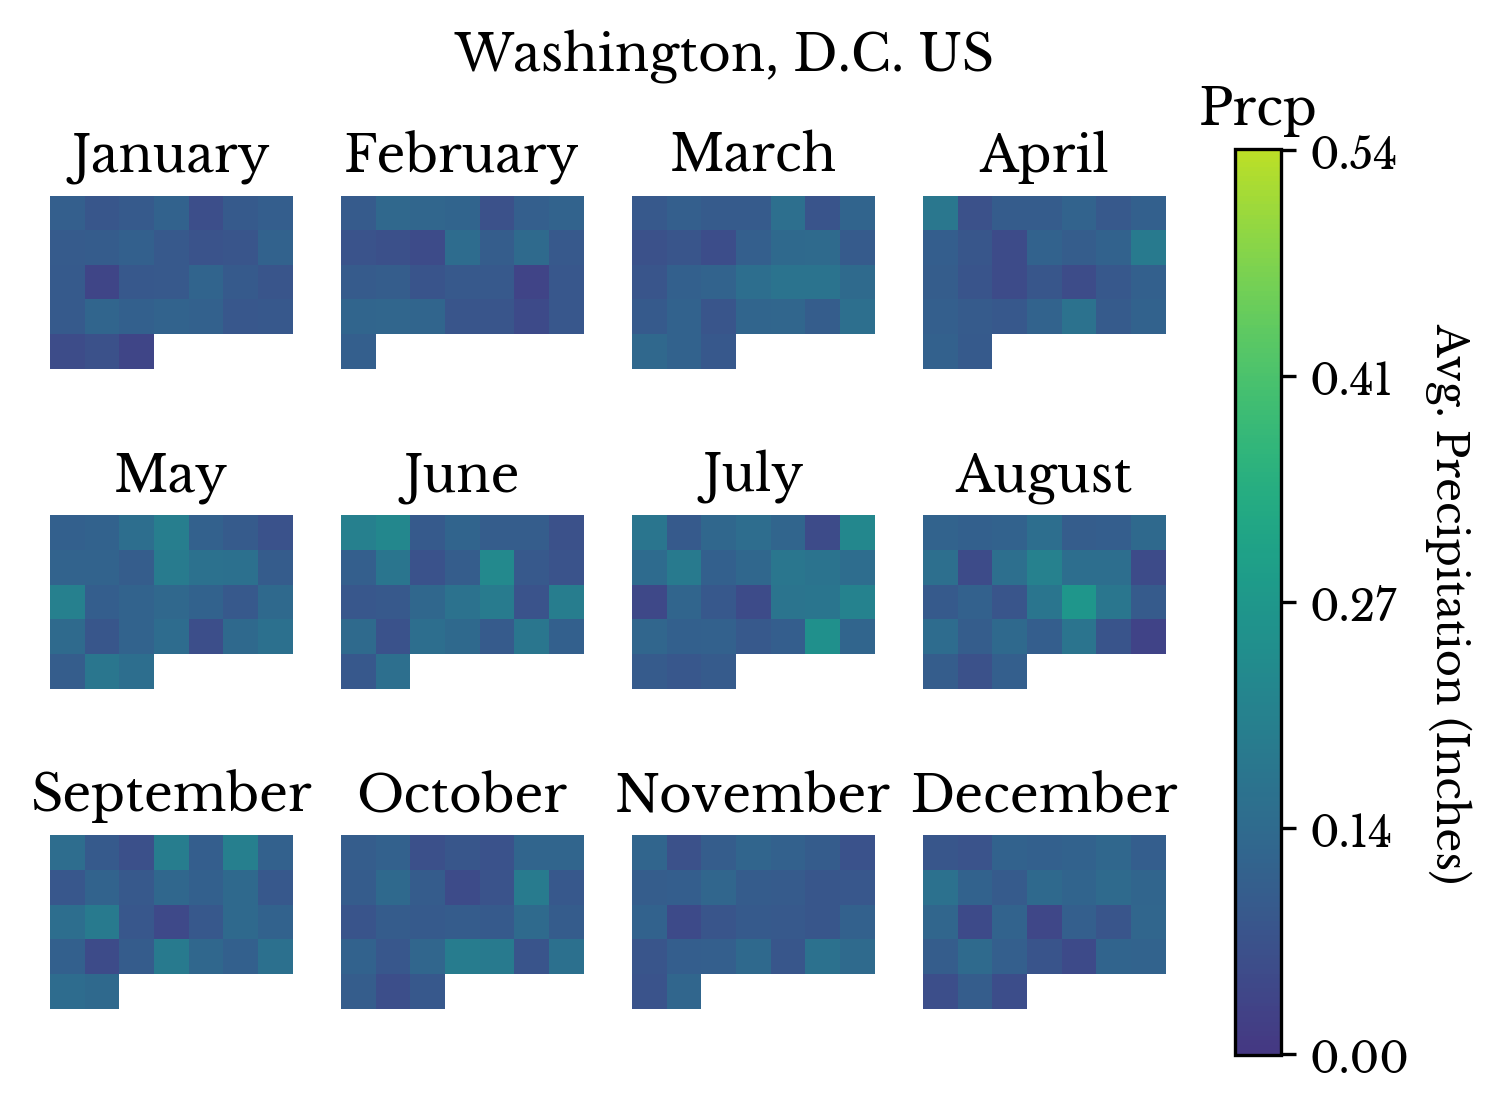
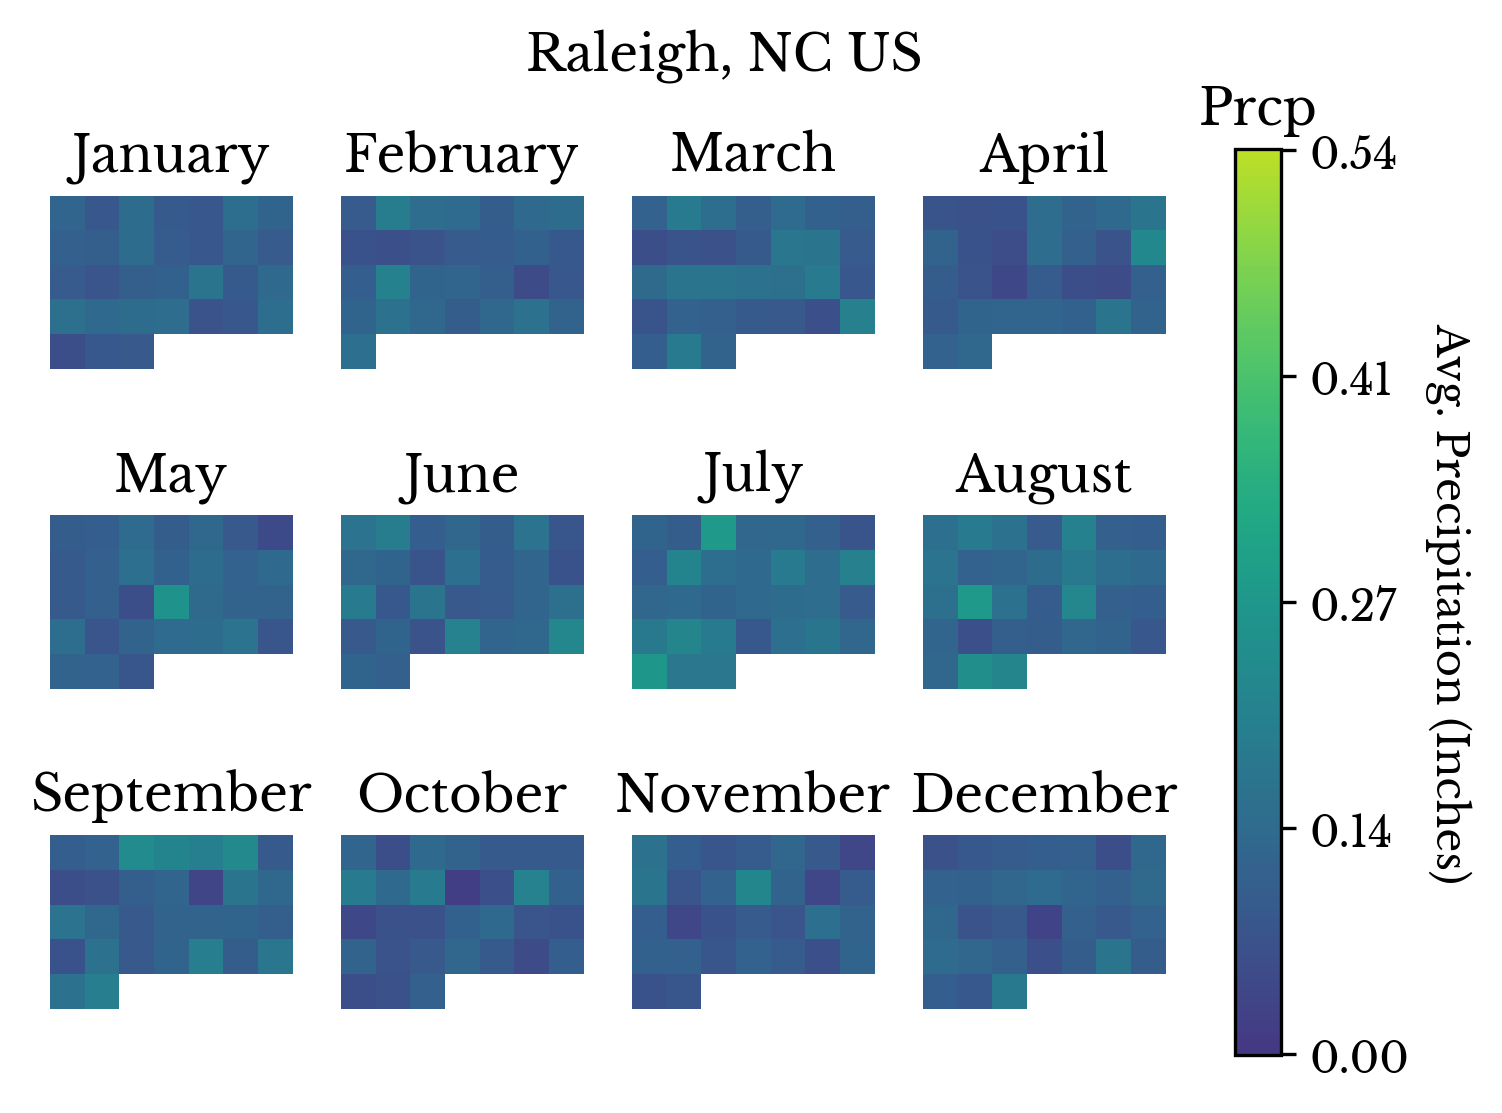
The following plots show the average amount of precipitation over the past 70 years for 8 cities in the USA. Each sub-image depicts a hypothetical calendar month and each colored square in a sub-image depicts a single day. The color of a given square describes the amount of precipitation a city receives for the day corresponding to that square on average.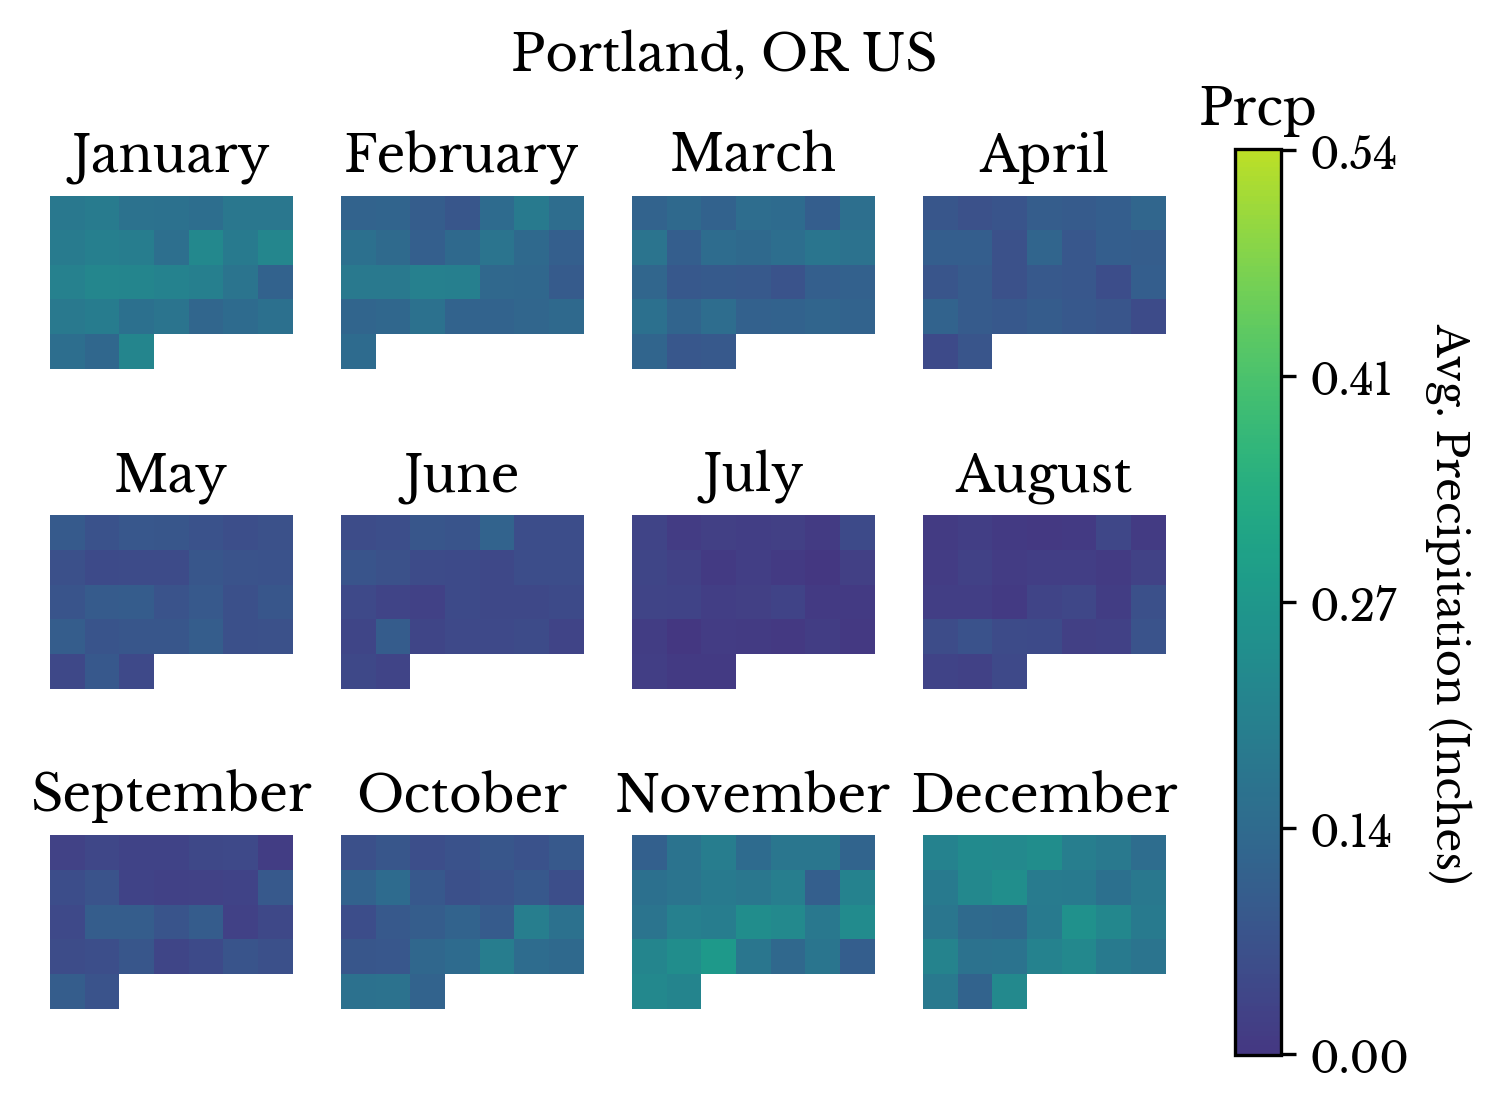 | 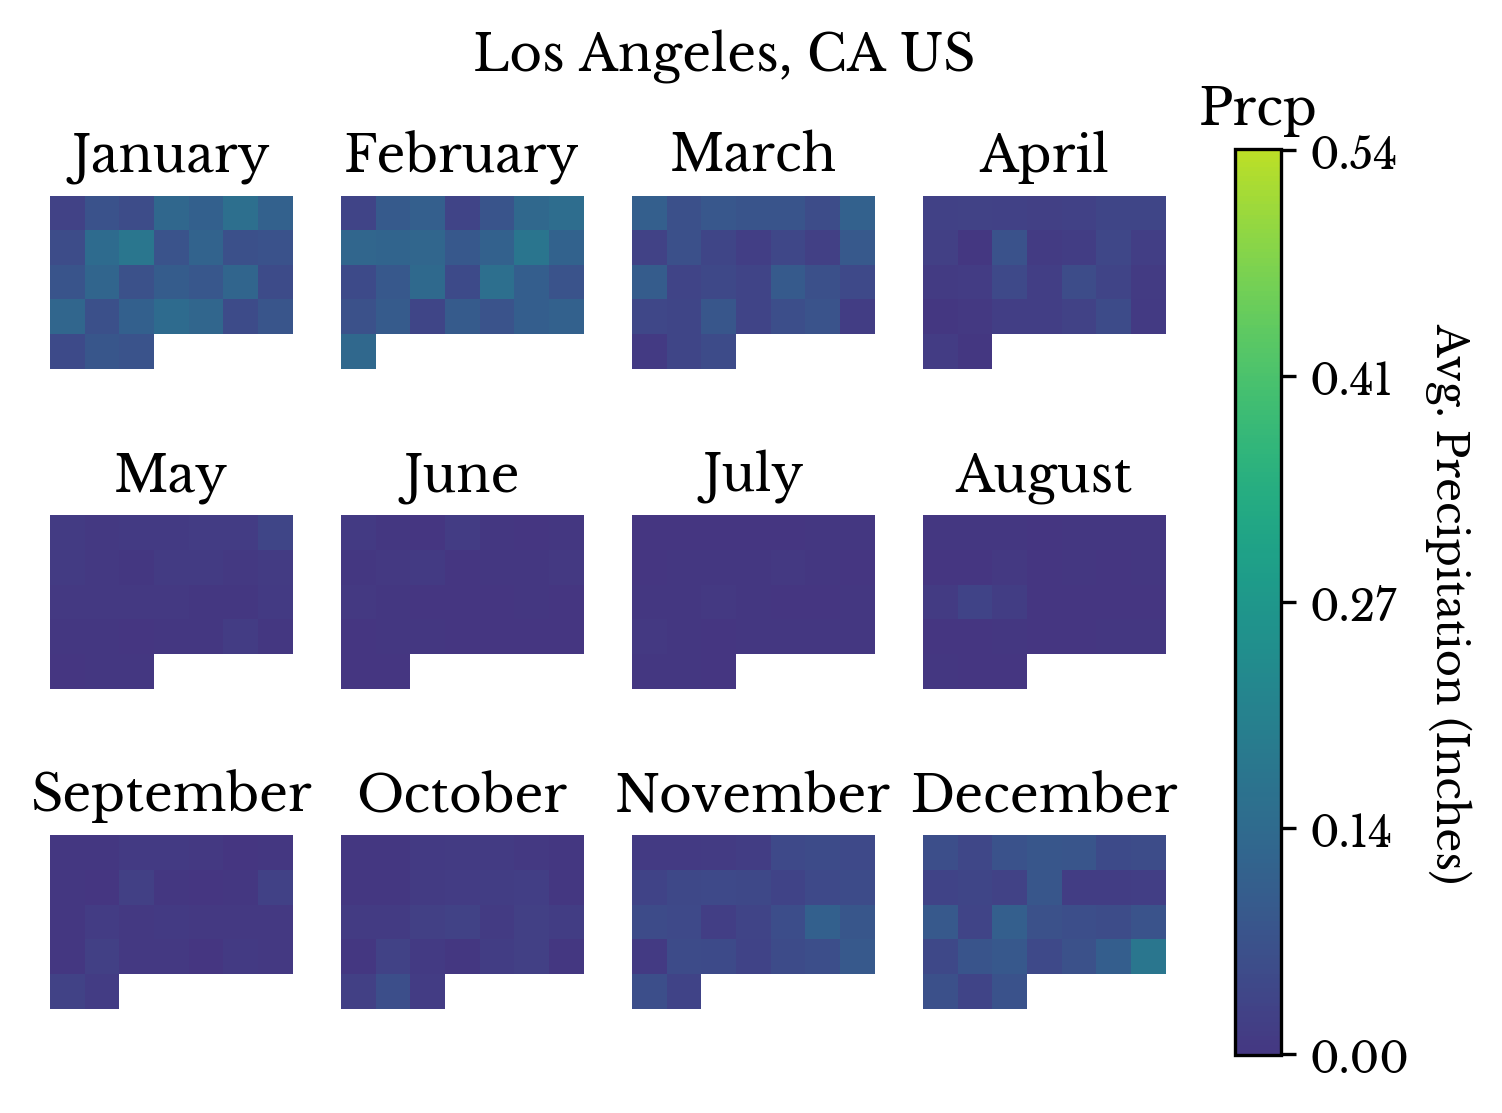 |
 |  |
 |  |
 | 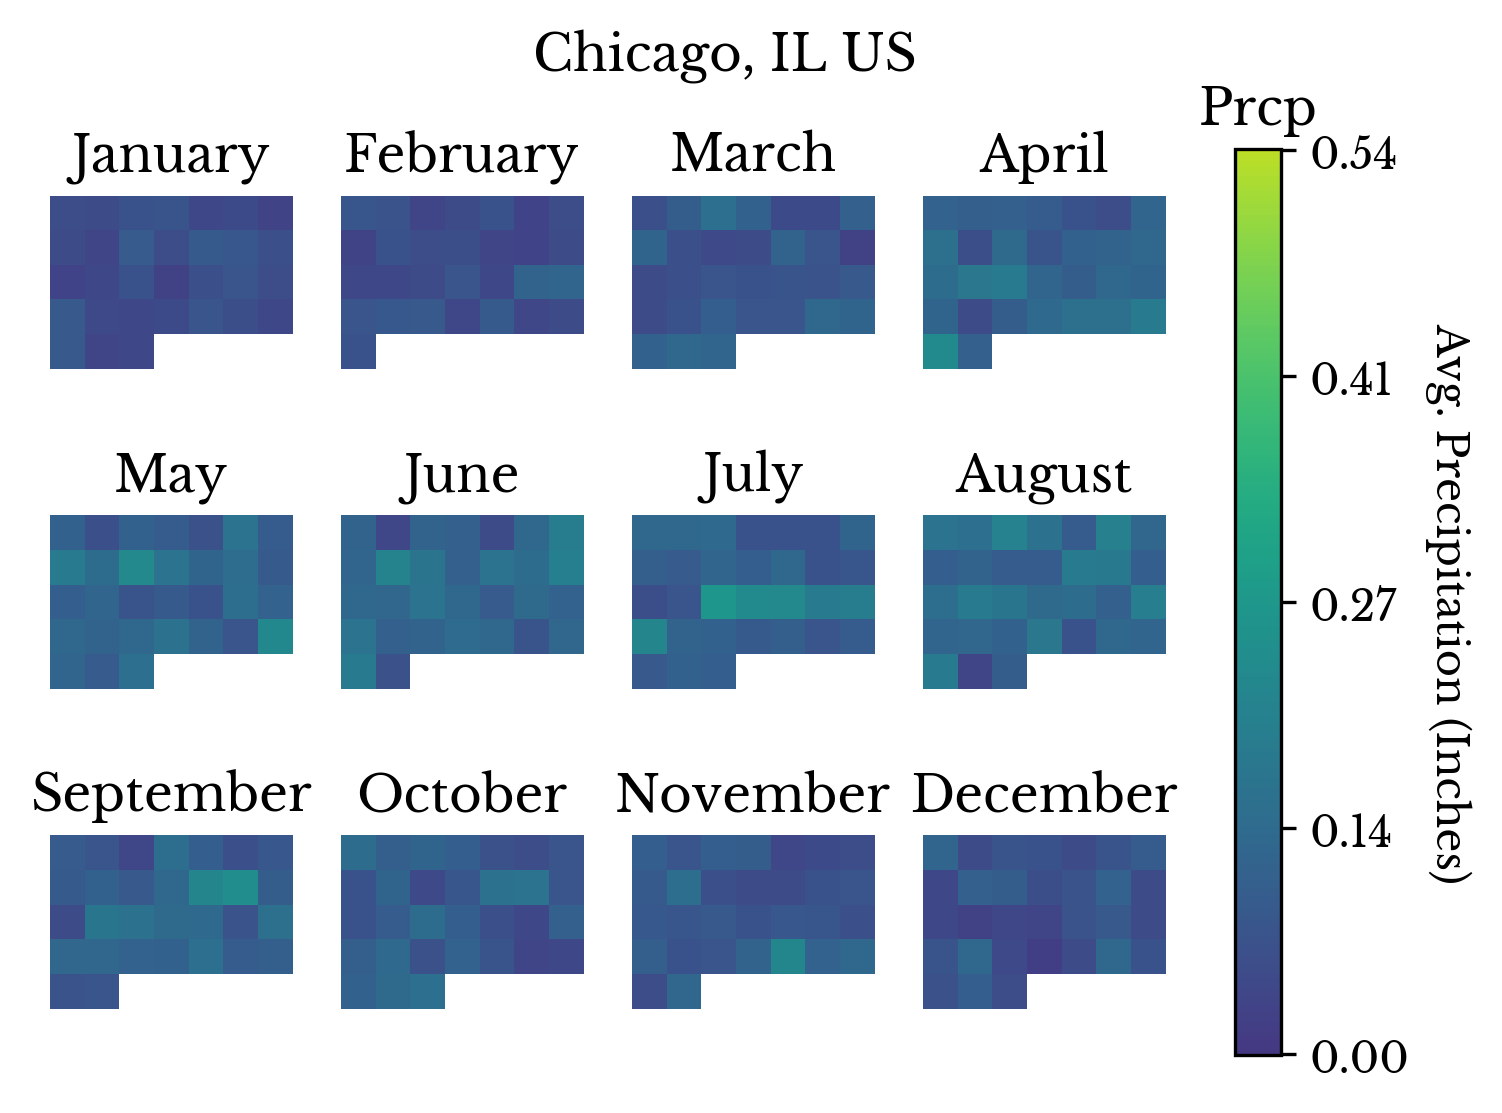 |
Figure 1: Precipitation Calendars
The color range is normalized across all eight cities. In this way, the relative average amount of precipitation for each city on any given day may be evaluated by comparing the two corresponding calendar squares.The calendar chart for Portland characterizes its dry summers and long rainy season. Los Angeles typically only receives rain during the winter months and this is reflected in its chart. Finally, Miami appears to receive the most amount of precipitation on average; the majority of this appears to occur in the summer months.
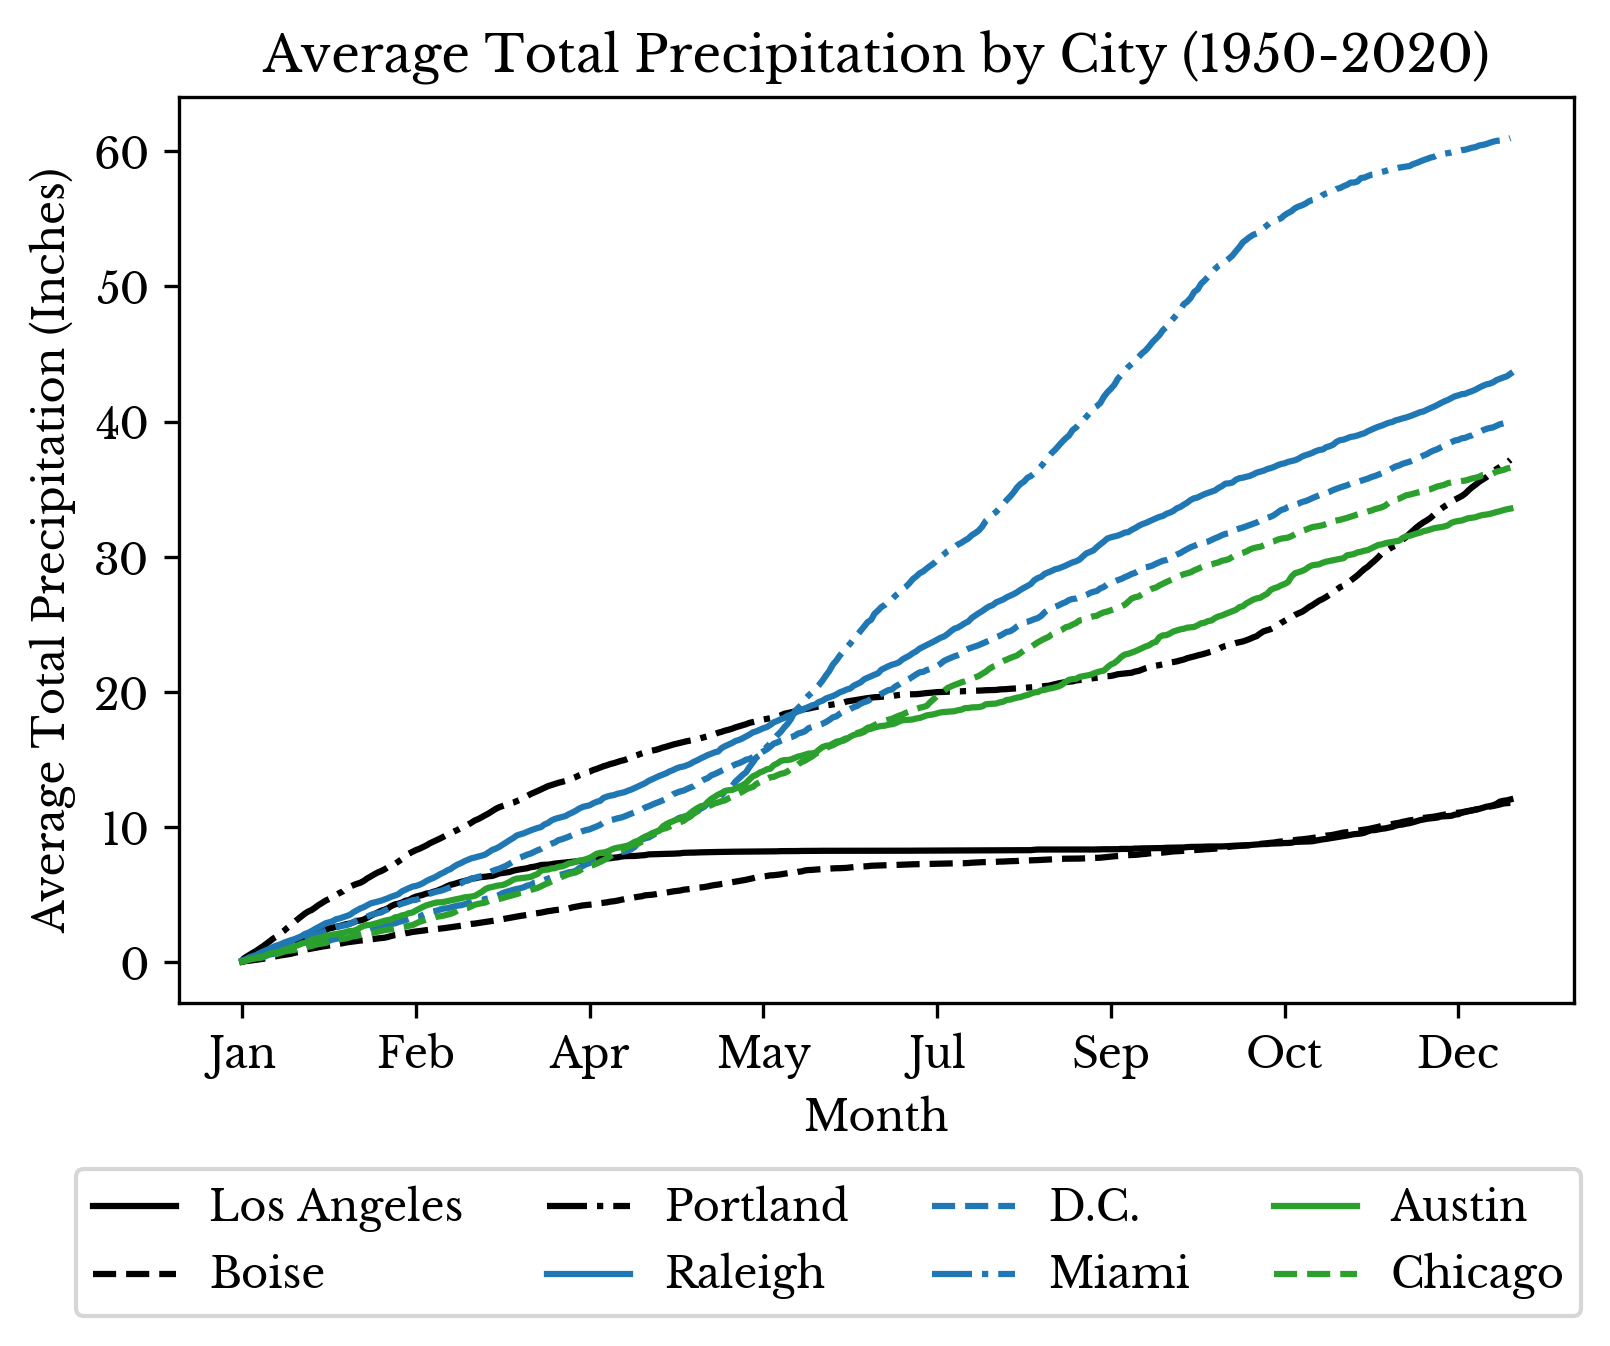
Figure 2: Cumulative Precipitation Curves
Figure 2 shows the average cumulative precipitation curves for the same 8 cities. This chart allows more direct comparison of the average yearly quantities of precipitation among the eight cities. The slopes of the curves shed light onto how this precipitation is distributed through the year. The subtle S-shape in the curve for Portland is a reflection of its relatively dry summers. Finally, as suggested by the calendar plots, Miami does indeed receive the greatest amount of yearly precipitation among the 8 selected cities on average.Next, charts describing the average number of rainy days per year for each of the eight cities are computed. A rainy day is taken to be any day where there is some amount of precipitation recorded. That is, any day where the precipitation measure is greater than zero.
 |  |
 |  |
 |  |
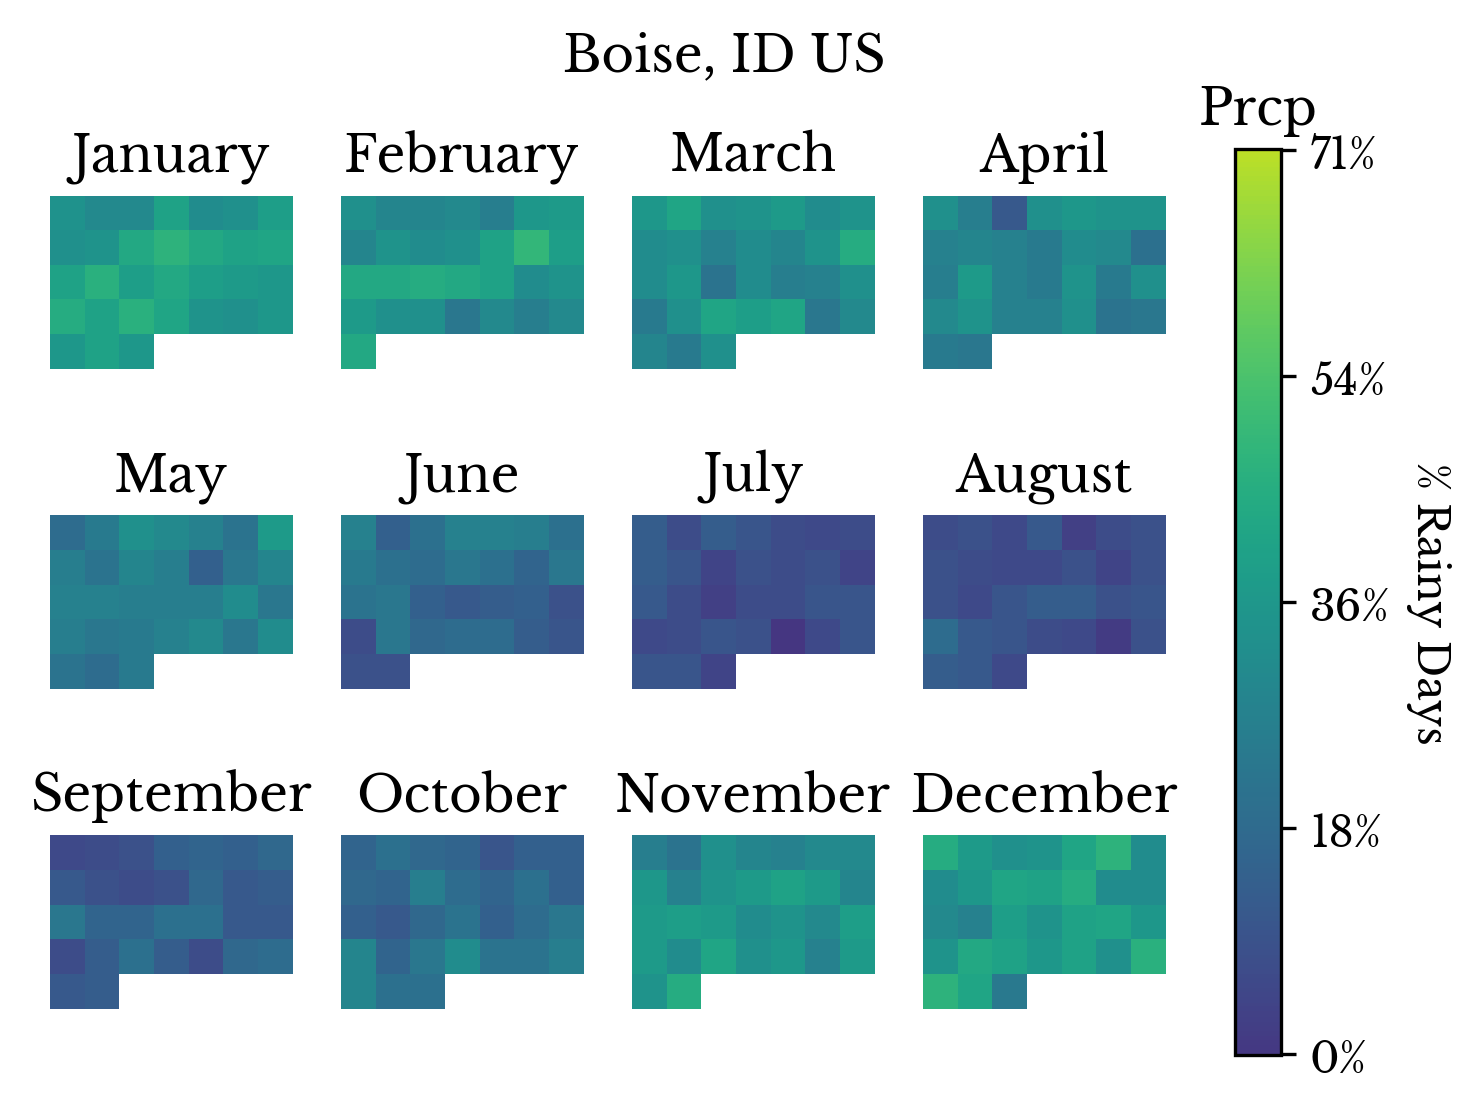 | 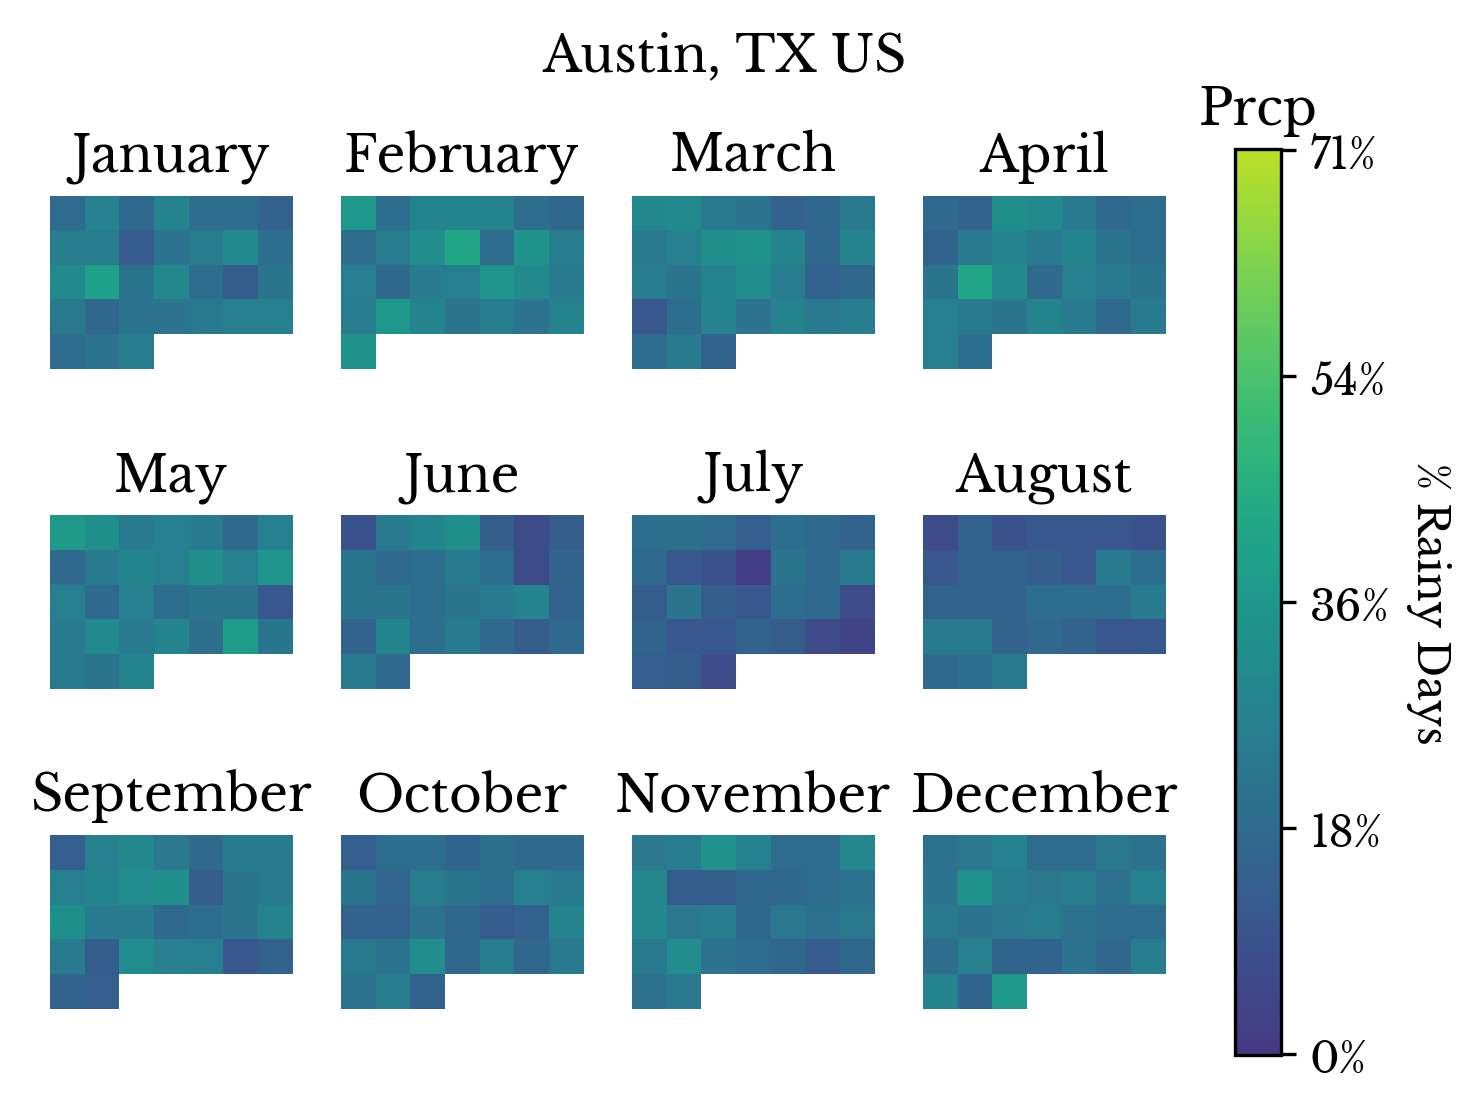 |
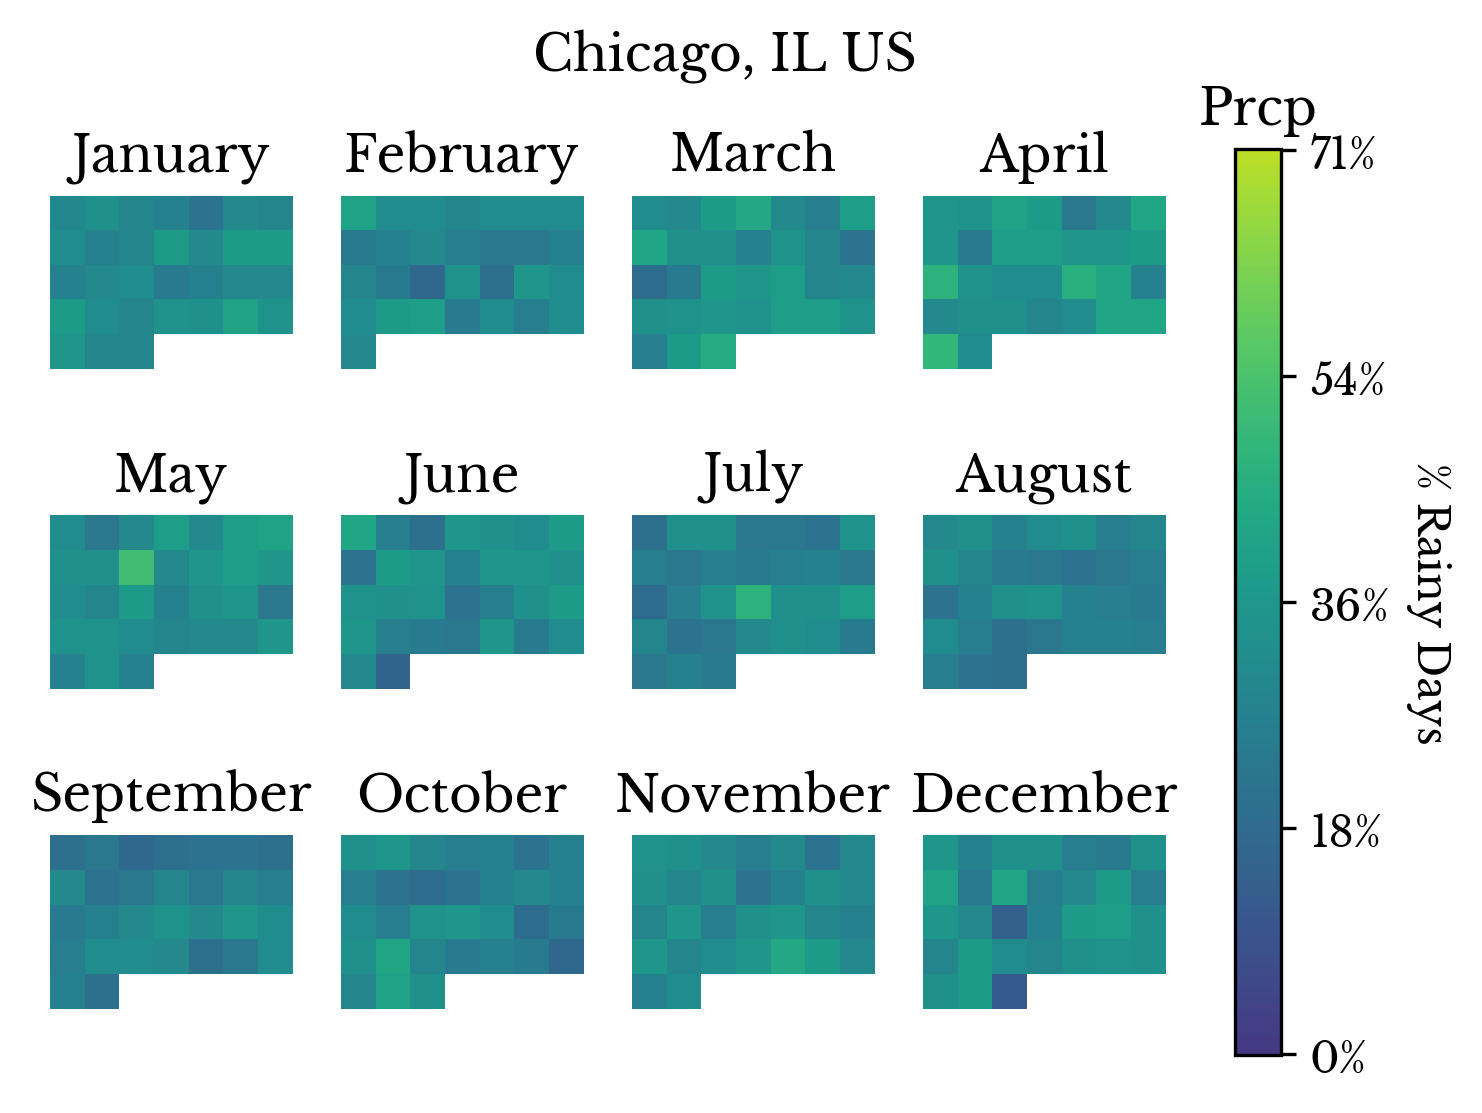
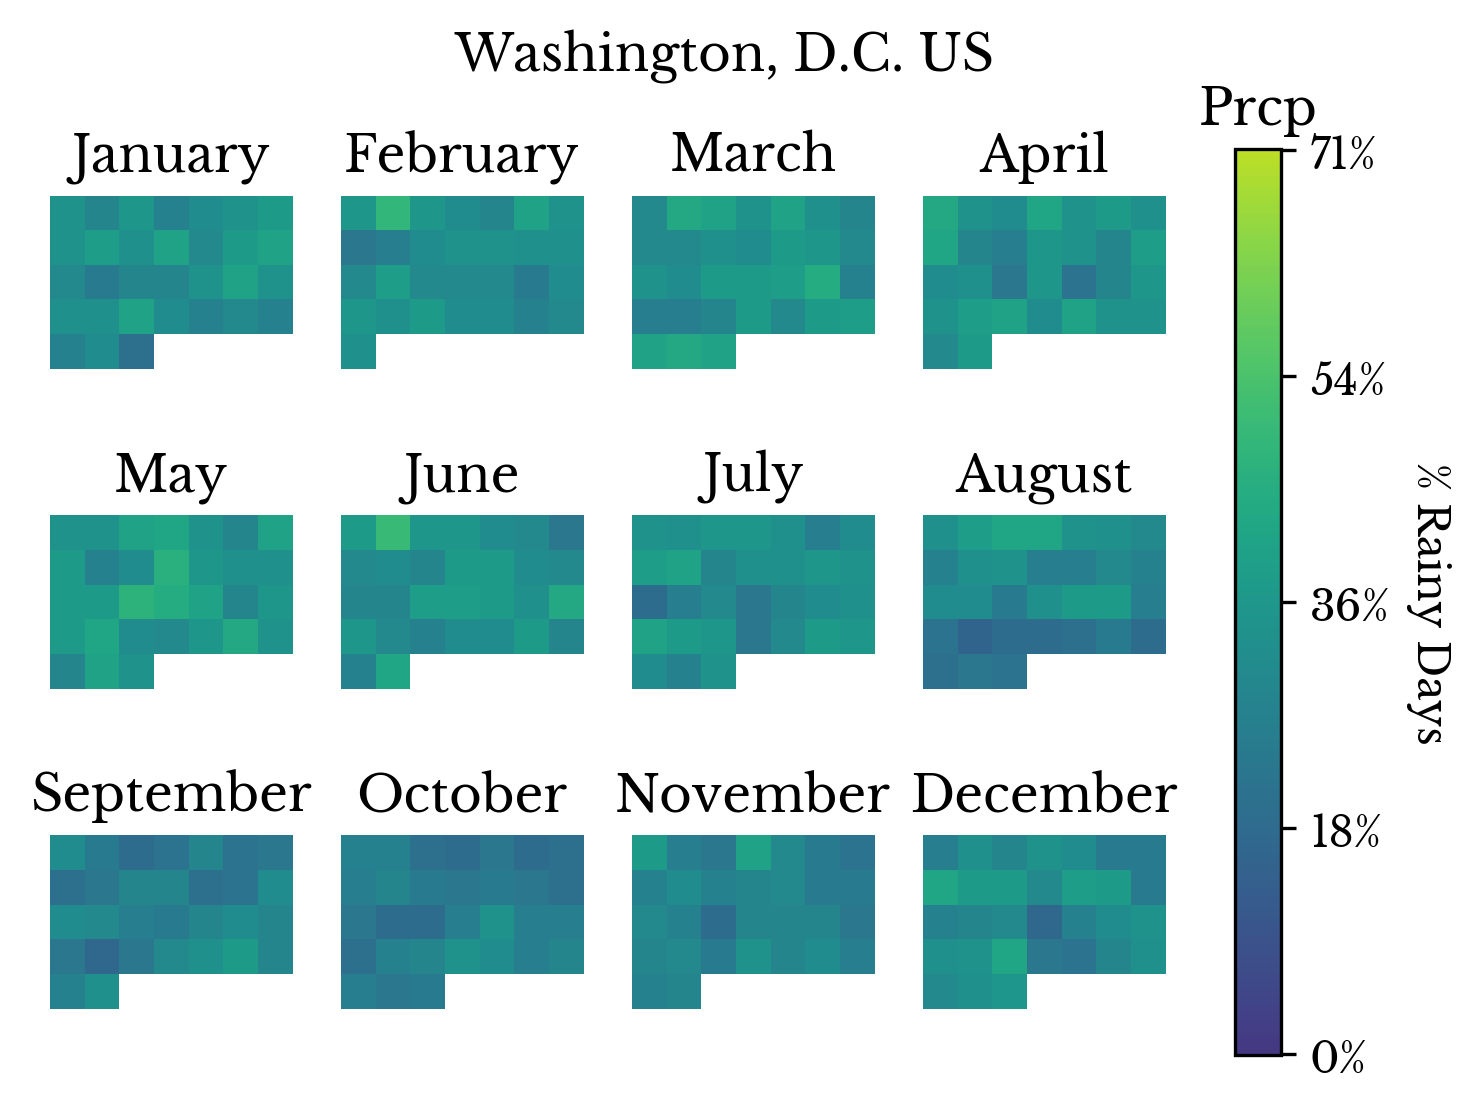
Figure 3: Rainy Day Calendars
In Figure 3, the color of a given square denotes the percentage of times in the past 70 years that it has rained on the day corresponding to that square. The chart for Portland is now much more colorful and the extent of the rainy season is more apparent. It is clear that Portland experiences a relatively large number of rainy days. Thus, taken in conjunction with Figures 1 and 2, this implies that each rainy day produces less precipitation than in other cities on average.
Figure 4: Cumulative Rainy Day Curves
The curves in Figure 4 depict the average cumulative number of rainy days in each of the 8 cities over the past 70 years. Figure 4 confirms that Portland indeed has the most number of rainy days among the eight selected cities on average.