CoV-2 Genome Explorer
Fri, 05 Feb 2021
Cov-2, Covid-19, Data Visualization, Genome Sequencing, Genomics
At the time of this writing, NCBI Virus has over 40,000 complete CoV-2 sequences available. I made an interactive webpage to help visualize a random subset of these genomes using principal component analysis.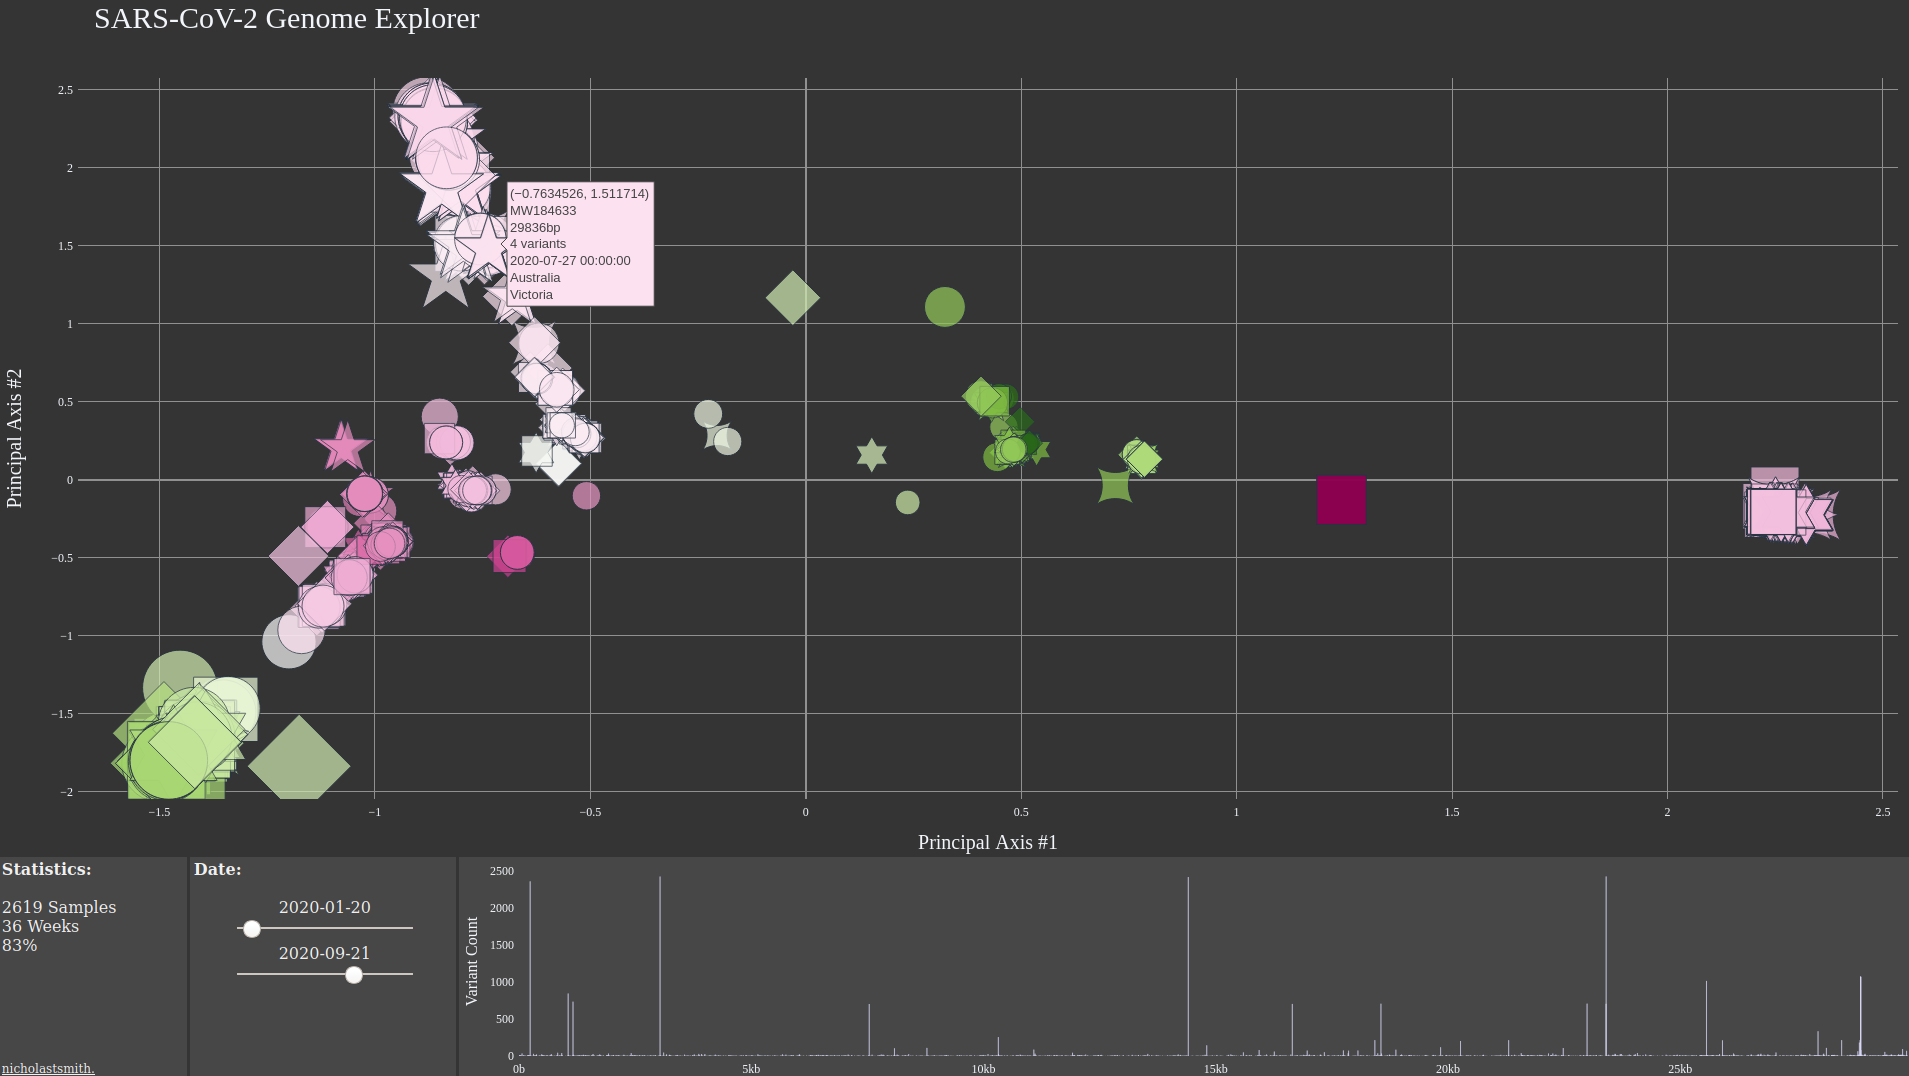
Figure 1: CoV-2 Explorer Interface
The x, y, size, and color axes respectively represent the first four principal axes. The plot markers identify viruses with unique nucleotide sequences in the GU280_gp02 (spike glycoprotein) gene region. The range sliders can be used to visualize shift in the viral genomes over time. The bar chart in the bottom right counts the frequency of SNP mutations in the sequences present in the specified date range.